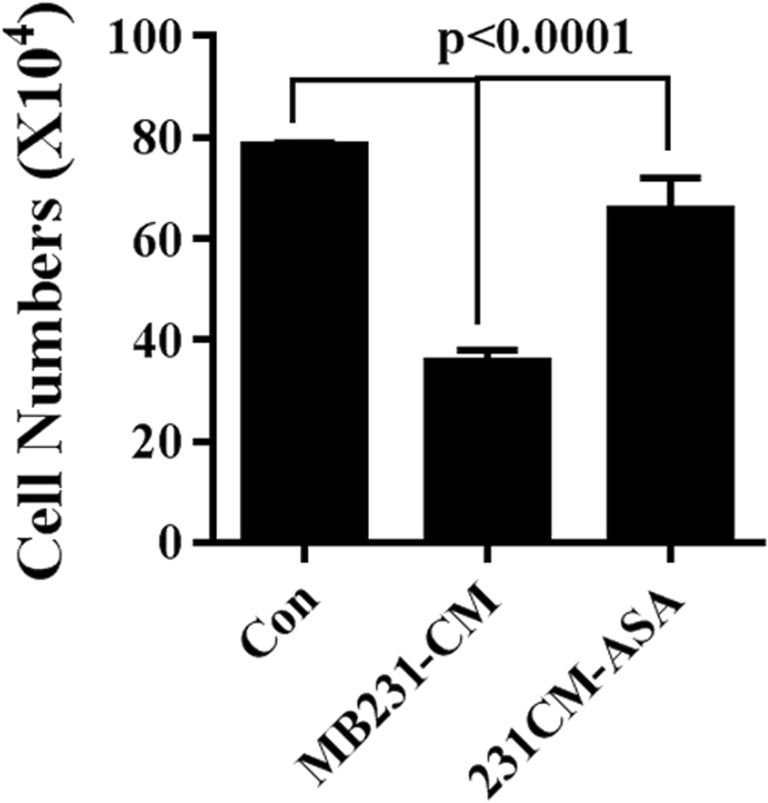
Fig. 2.

Effects of ASA on proliferation of 10 T1/2. Graphical representation of cellular count of 10 T1/2 in presence of MDA-MB-231 CM (with or without ASA pre-treatment). Regular medium (RM) was used as control. Data expressed as Mean ± SD of three sets of experiments. For statistical analysis ANOVA was done
