Fig. 3.
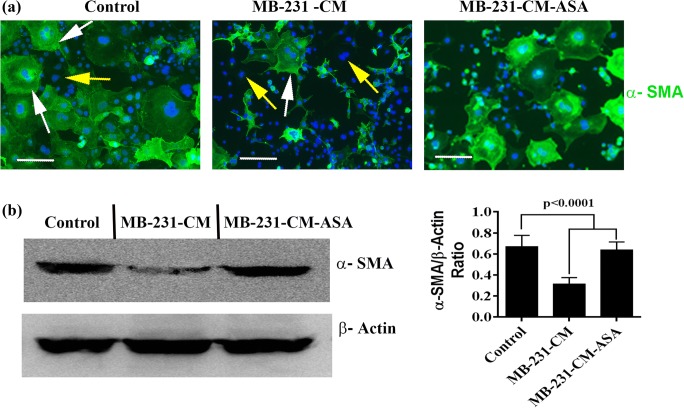
ASA rescue α-SMA expression. a Immunofluorescence of α-SMA in 10 T1/2 cells in presence of regular media (control) or MDA-MB-231 cell derived CM (MB-231-CM) or ASA pretreated MDA-MB-231 cell derived CM (MB-231-CM-ASA). White arrow indicates α-SMA positive cells and yellow arrow indicates α-SMA-negative cells, and (b). Immunoblots of α-SMA and β-Actin in treated and untreated 10 T1/2 cells. β-actin was used as internal loading control. Bar graph represents relative expression of α-SMA in treated and untreated 10 T1/2 cells. Error bars denote mean ± SD, n = 3. Scale, 50 μm. For statistical analysis two paired student’s t test and ANOVA were done

