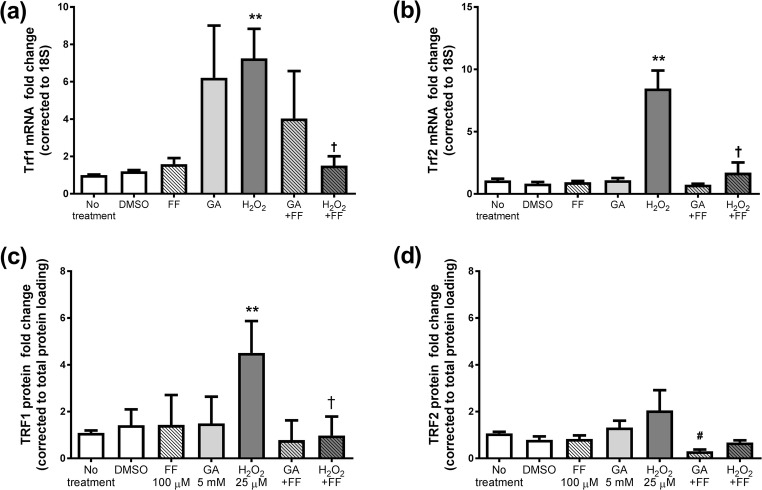
Fig. 2.
The mRNA levels of (a) Trf1, (b) Trf2 and protein on average for (c) TRF1, (d) TRF2 after 7 days treatment with 5 mM GA or 25μΜ H2O2 in the presence or absence of 100μΜ FF. Data is mean ± SEM fold change vs. control cells. Students’ t-test *P < 0.05, **P < 0.005 vs. no treatment, †P < 0.05 t-test vs. H2O2

