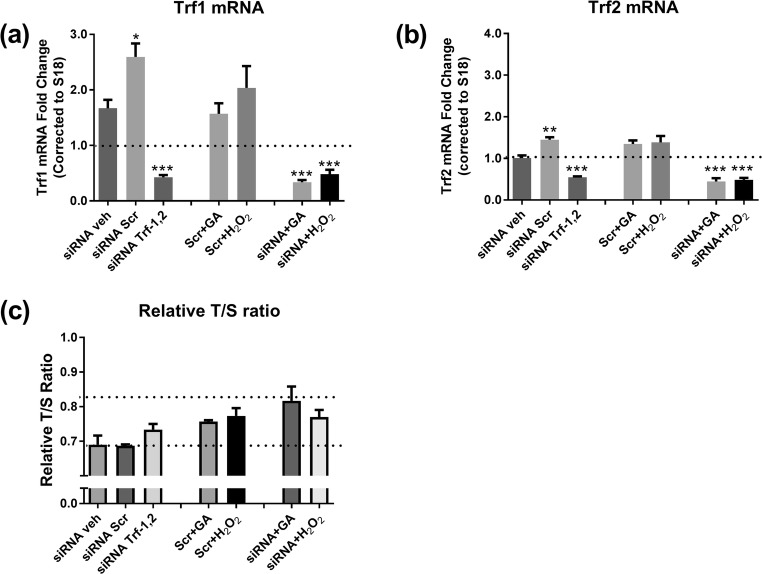
Fig. 4.
Effect of Trf1 and Trf2 siRNA on (a) Trf1 mRNA expression compared with cells treated with vehicle (veh), scramble (scr) in the presence or absence of GA or H2O2; (b) Trf2 mRNA; (c) RTL. Data is mean ± SEM. Results were analysed by Students’ t-test, *P < 0.05, **P < 0.005, ***P < 0.0005 vs. siRNA vehicle

