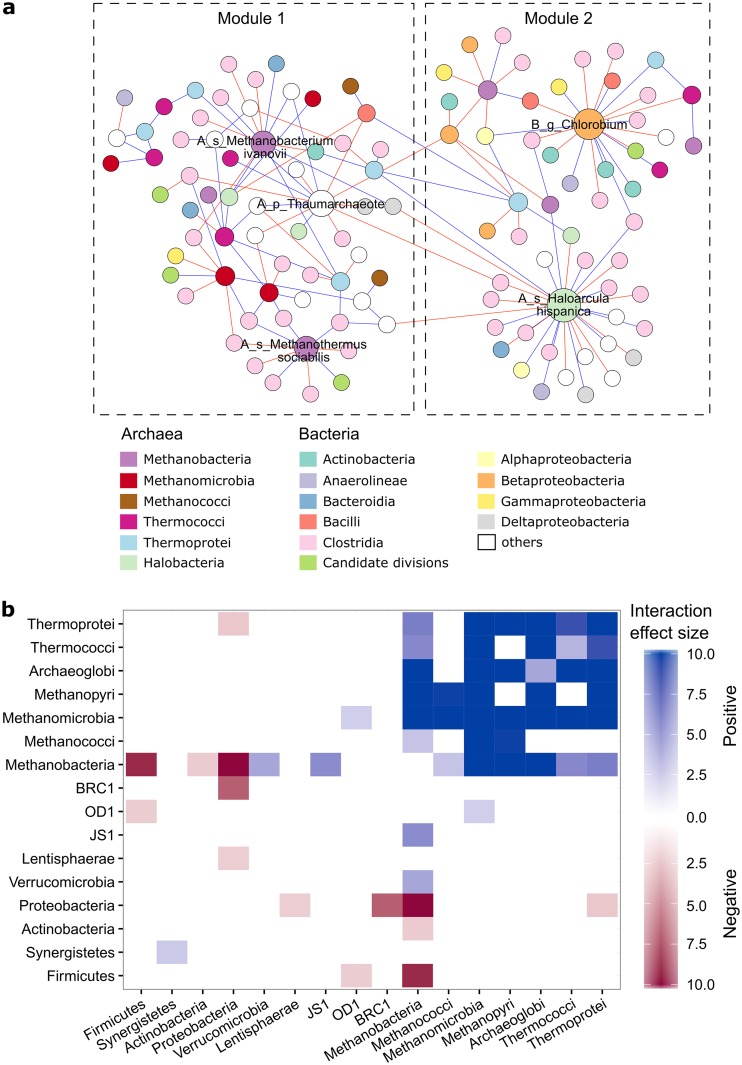
FIG 2.
Interactions between microbial taxa revealed by the association network. (a) The two largest modules in the overall network constructed from all 66 samples. Nodes are colored according to OTU taxa. Labeled nodes are the hubs identified as module hubs. Node labels stand for the lowest taxonomic rank (A_ and B_ represent Archaea and Bacteria, respectively; p_, g_, and s_ represent phylum, genus, and species, respectively) of OTUs, and the node size is proportional to its degree. Blue edges represent positive associations, while red edges represent negative associations. (b) Interaction effect size between microbial taxa. The interaction effect size between any two groups was calculated as the difference of observed and random networks divided by the standard deviation. The heatmap shows only interactions with an effect size larger than 2.

