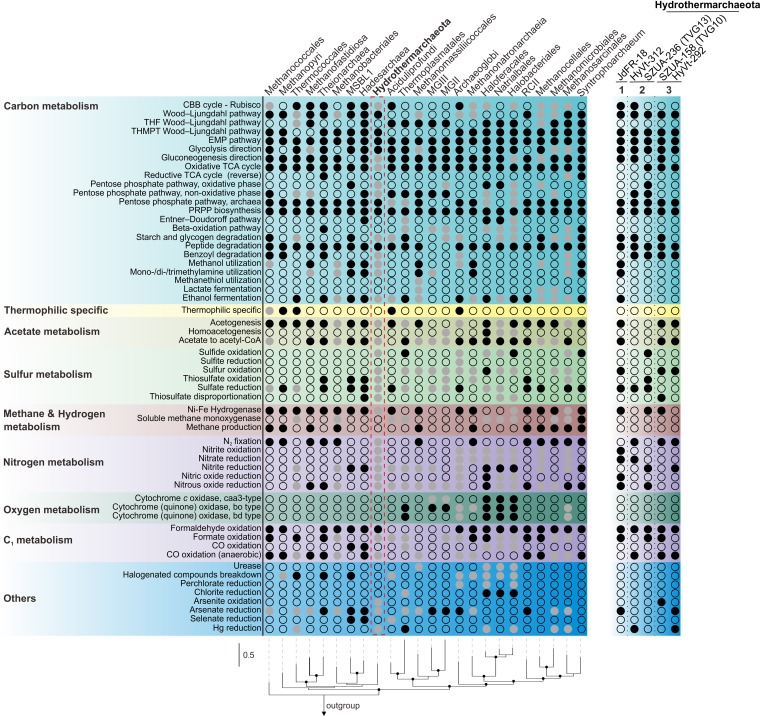
FIG 4.
Comparison of the metabolic capacity of Hydrothermarchaeota and Euryarchaeota. Metabolic marker genes from the Pfam, TIGRfam, and KEGG databases were used to identify the corresponding sequences in up to five genomes within one archaeal group. Solid black dots, solid gray dots, and blank dots, present in all genomes, present in some genomes, and not present in any genome, respectively. If one marker gene was identified, it was assumed that the corresponding metabolic function exists. Because of the limited number of genomes and low genome completeness, solid black dots were used to denote gene identification in one genome for Hadesarchaea, Hydrothermarchaeota, Theionarchaea, Syntrophoarchaeum, and MSBL-1. A detailed summary of the information is provided in Text S1 in the supplemental material. The metabolic capacity of five Hydrothermarchaeota MAGs is also depicted. The RP phylogenetic tree was constructed by randomly selecting one genome from each group; bootstrap values over 75% are depicted as black dots on the node.

