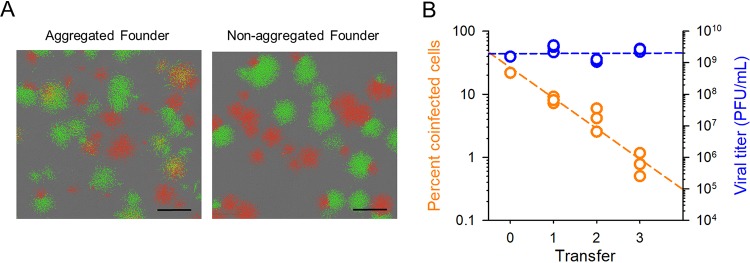
FIG 1.
Evolution of saliva-driven coinfection rates. (A) Founder virus. Fluorescence micrographs of infection foci produced at 12 hpi in BHK-21 cells. Right, cells were inoculated with a 1:1 mix of VSV-GFP and VSV-Cherry (nonaggregated). Left, prior to inoculation, viral particles were aggregated in the presence of human saliva. Yellow foci indicate coinfection of cells with the two variants. The gray background shows noninfected cells in phase contrast. Bar = 1 mm. (B) Progressive loss of coinfection in viruses evolved under the saliva-driven aggregation regime (orange) and titer reached by these lines after each transfer (blue). The percentages of cells coinfected with VSV-GFP and VSV-mCherry were determined in cultures infected with saliva-treated virus after each evolution transfer using flow cytometry. Viral titers were quantified after each transfer by the plaque assay. Each dot represents an evolution line (one dot for the founder, three dots for evolved lines). Least-squares regression lines (dashed) are shown.

