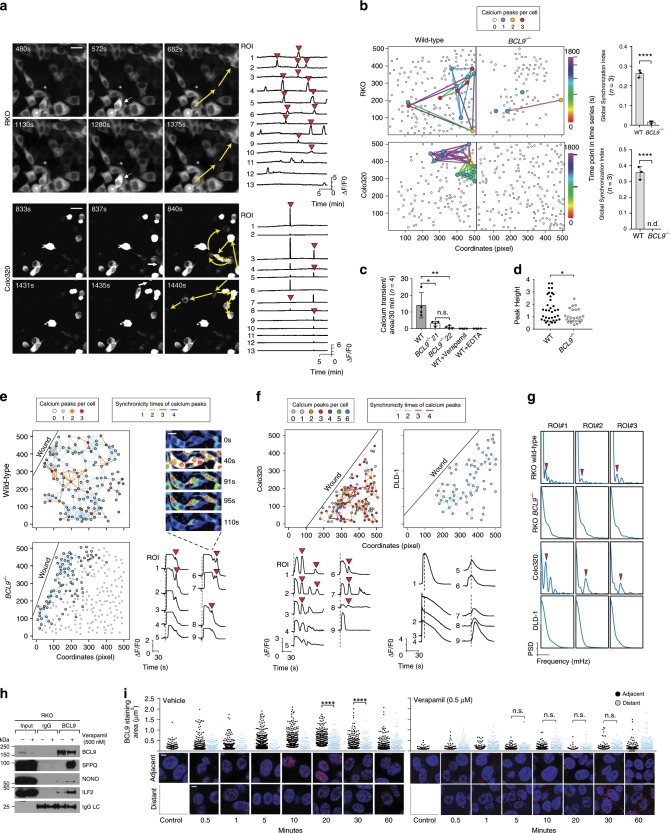
Fig. 4. Lack of BCL9 inhibits the occurring and spreading of calcium transients.
a Time-lapse imaging demonstrating the spread of calcium transients among cells (left), average calcium transient curve (ΔF/F0) of all cells with calcium transients in one microscope field (right). Initiating cell (white arrows), direction of propagation (yellow arrows). Synchronicity of calcium transients is highlighted by red triangle. Scale Bar: 10 µm. b Left: network of synchronized calcium transients in the indicated wild-type and BCL9 knockout cells. Each dot represents one cell, the colored dots indicate the number of calcium wave events during 30 mins. Edged-linked dots represent synchronized calcium transients, colored edge indicates the timing of synchronized calcium transients. Right: synchronicity of global calcium transients in the indicated cells was calculated in wild-type and BCL9 knockout by FluoroSNNAP, n.d. non-detectable. P values were calculated using Student’s t test. ****P < 0.0001. c Frequency of calcium waves occurring in the indicated wild-type and BCL9 knockout RKO cells in the absence or presence of Verapamil or EDTA. P values were calculated using Student’s t test. *P < 0.05; **P < 0.01; ns: not significant. d Peak height of calcium transients in wild-type and BCL9 knockout RKO cells. P values were calculated using Student’s t test *P < 0.05. e Network of calcium transients spreading (left) and ΔF/F0 of synchronized “secondary waves” (right) after wound scratching in wild-type and BCL9 knockout RKO cells. Each circle represents one cell, colors represent times of simultaneous calcium transients. Edged-linked dots represent synchronized calcium transients, colored edge indicates times of synchronized calcium transients. Red triangle: “secondary waves”; Black line: wound edge. Scale bar: 5 µm. f ΔF/F0 and heatmap showing display of “secondary waves” in Colo320 but not in DLD-1 cells. g The frequency spectrum of calcium waves of indicated ROI in parts e and f. h Co-IP of the indicated proteins in RKO cells treated for 2 h with vehicle (−) or verapamil (+). i Time-course IF depicting changes in BCL9 staining area in cells located adjacent or distant from scratched edge in vehicle (left) or Verapamil (right) treated RKO cells. P values were calculated using Student’s t test. ****P < 0.0001; n.s.: not significant. Data are displayed as mean ± SD. Scale bar: 1 µm. See also Supplementary Figs. 11 and 12. Source data are provided as a Source Data file.

