. 2019 Dec 17;61(1):42–50. doi: 10.4111/icu.2020.61.1.42

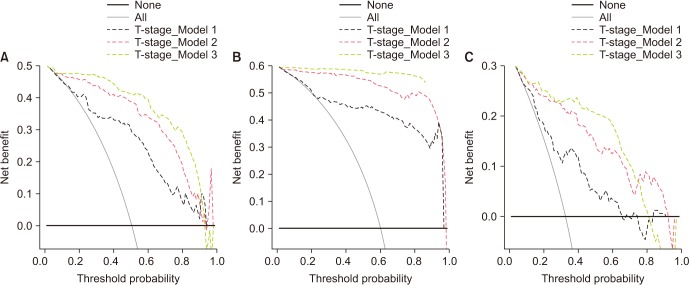
Fig. 3. Decision curve analysis of the effect of the prediction models. The net benefit is plotted against various threshold probabilities. (A) Detection of pT3 at radical prostatectomy. T-stage model 1 is a basic model that includes clinical stage, percentage of positive biopsy core, total prostate-specific antigen (tPSA), free PSA (fPSA), percent fPSA (%fPSA), biopsy Gleason sum (GS), and PSA density. T-stage model 2 is a basic model that includes all factors of model 1 plus a percentage of p2PSA to fPSA (%p2PSA). T stage model 3 is a basic model, which includes all factors of model 1 plus the Prostate Health Index (PHI). (B) Detection of pathologic GS ≥7 at radical prostatectomy. GS model 1 is a basic model that includes clinical stage, percentage of positive biopsy core, tPSA, and %fPSA. GS Model 2 is a basic model that includes all of the factors of model 1 plus %p2PSA. GS model 3 is a basic model that includes all of the factors of model 1 plus the PHI. (C) Detection of the presence of GS upgrading at radical prostatectomy. Upgrading model 1 is a basic model that includes clinical stage, percentage of positive biopsy core, tPSA, and %fPSA. Upgrading model 2 is a basic model that includes all of the factors of model 1 plus %p2PSA. Upgrading model 3 is a basic model that includes all of the factors of model 1 plus the PHI.

Fig. 3