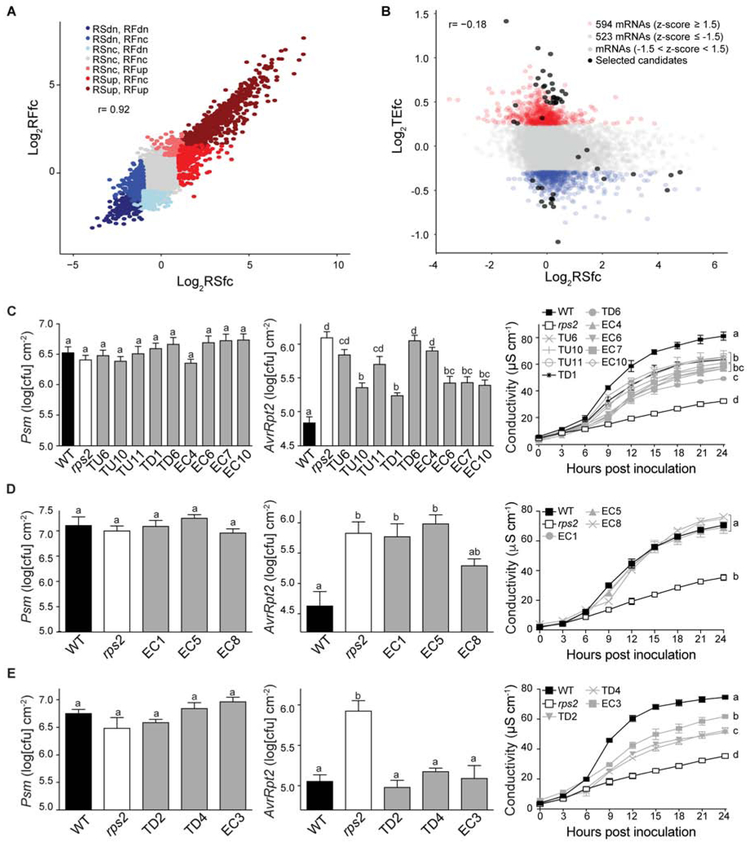
Figure 2. Identification of new immune regulators based on global analysis of translational changes during RPS2-mediated ETI.
(A and B) Relationships between RSfc and RFfc (A), and between RSfc and TEfc (B) in WT. dn, down; nc, no change. Black dots, candidates selected for ETI phenotype testing. (C–E) Growth of Psm ES4326 (left) or Psm ES4326/AvrRpt2 (middle) (OD600nm = 0.001), and ion leakage analysis (right) caused by Psm ES4326/AvrRpt2 (OD600nm = 0.01) in phenotypic group A (C), group B (D), and group C (E) of new immune regulators. WT and rps2 were used as controls. TU, TEup; TD, TEdn; EC, ETI candidate. Different letters indicate values that are significantly different based on Tukey’s test (P < 0.01; one-way ANOVA). For ion leakage analysis, the last time point was used for statistical analysis. Data are mean ± SEM; n = 8 biological replicates for bacterial growth and n = 3 biological replicates for ion leakage analysis.

