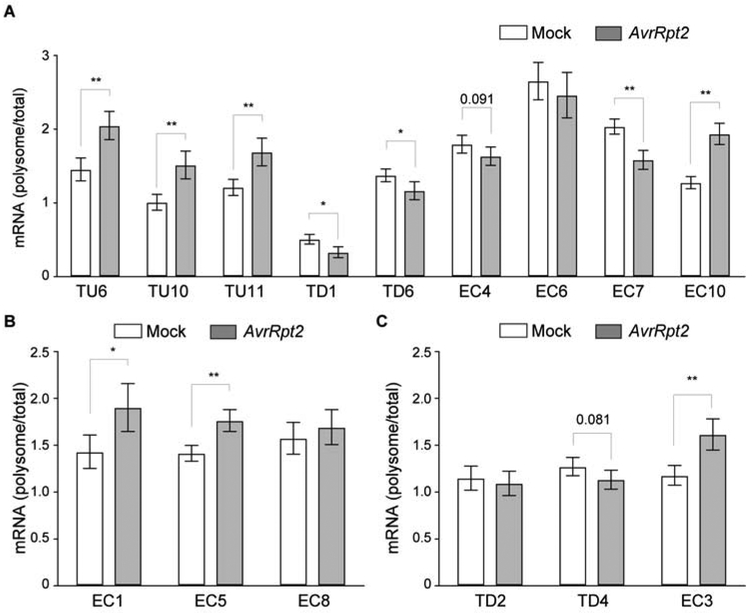
Figure 3. mRNA association with ribosomes upon ETI induction.
(A–C) Ribosomal associations of ETI-gene mRNAs were calculated as polysomal/total mRNA fractions with mock or ETI (AvrRpt2) induction. Expression levels were normalized against UBQ5. (A), (B), and (C) correspond to Figure 2C, 2D, and 2E, respectively. Data are mean ± SD; n = 3 three biological replicates. Data were combined using linear mixed effect model (lme4) with experiment as random effects; * P < 0.05 and ** P < 0.01 as determined by student's t-test.
See also Table S1.

