
Fig. 5. Cell-centered networks vary by neuronal class and sensitivity to arousal.
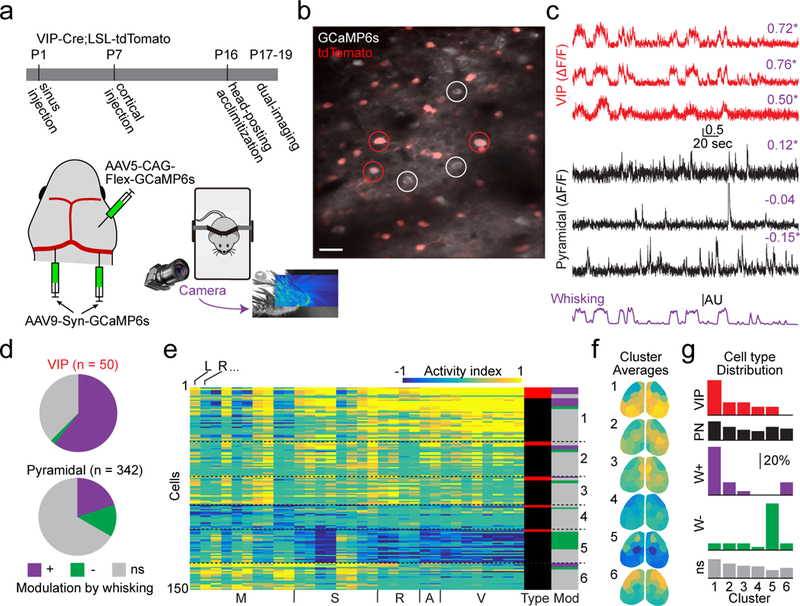
a, Schematic of experimental timeline and setup, including whisker tracking videography. Image shows example facial videography frame overlaid with whisker motion energy heat map. Warmer colors indicate higher mean pixel motion energy. b, Mean two-photon image from data acquired during dual-imaging showing GCaMP6s expression in tdTomato-positive (VIP-INs, examples circled in red) and -negative (presumptive pyramidal neurons, examples circled in white) cells. Scale bar is 20 μm. Image is representative of 15 fields-of-view across 4 mice. c, ΔF/F traces from VIP cells (red) and putative pyramidal cells (black) aligned with whisker motion energy (purple). Pearson’s correlation of ΔF/F with whisking is listed above each trace, with asterisks indicating significant values (p < 0.01, shuffle test, 1000 shuffles). d, Relative numbers of VIP-INs and pyramidal cells that are positively-, negatively-, or not significantly (ns) correlated with whisking (p < 0.01, shuffle test). e, Activity index calculated from all significance maps for all cells recorded in a single animal. Cells are clustered into six groups. Columns to the right indicate cell type (red indicates VIP-IN, black indicates pyramidal cell) and whether cells are correlated with whisking (colors as in d). f, Averages of the six clusters in (e) with parcels colored by their activity index. g, Fractional distribution of cells into each cluster, separated by type or modulation by whisking.