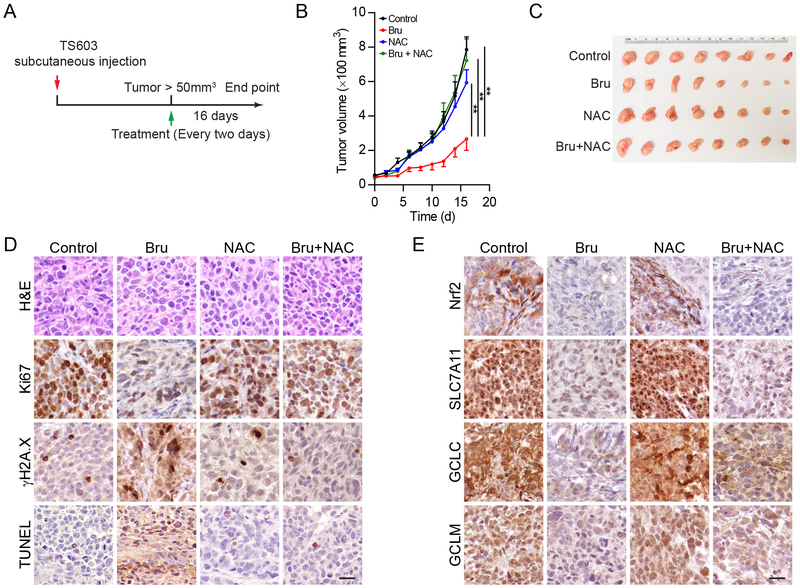
Figure 5.
Targeting Nrf2/GSH axis suppresses IDH1-mutated xenografts
A. Schematic illustration for the xenograft and treatment schedule.
B. Tumor growth curve of TS603 xenografts. n=10 for each group. **p<0.01.
C. Gross anatomy of TS603 xenografts.
D. Immunohistochemistry assay showed the expression of Ki67, γH2A.X and TUNEL assay in tumor sections. Bar = 50 μm.
E. Immunohistochemistry assay showed the expression of Nrf2, SLC7A11, GCLC and GCLM in tumor sections. Bar = 50 μm.

