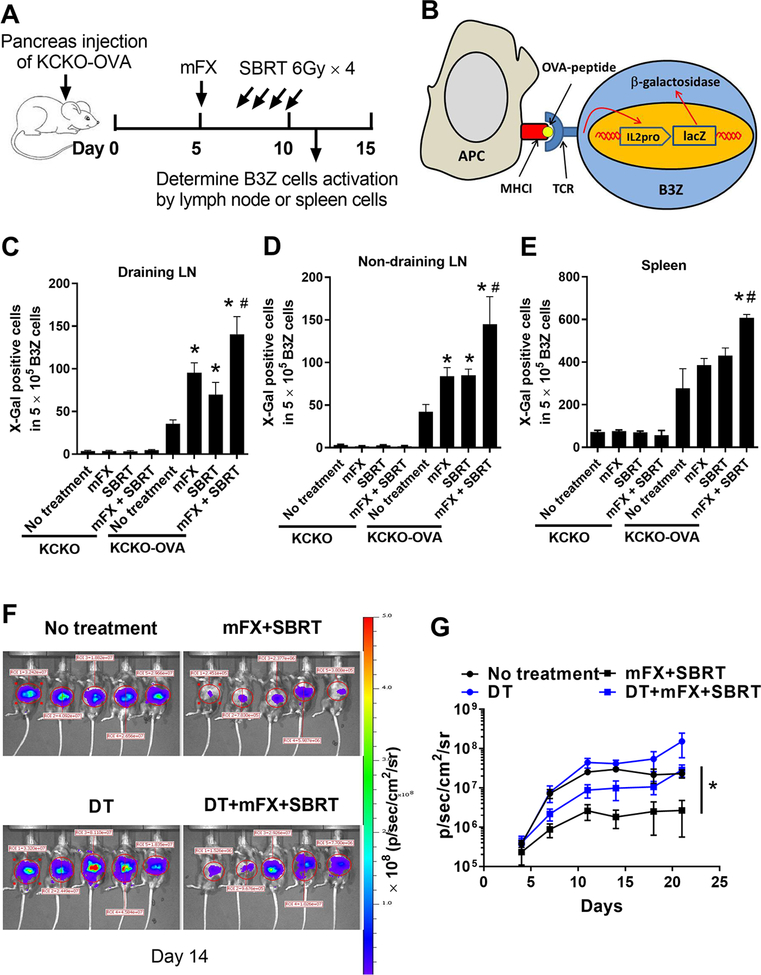
Figure 4. Enhanced tumor antigen presentation after concurrent mFX and SBRT treatment.
(A) Schematic of experimental design. Mice were sacrificed on day 11 and antigen presentation was detected with lymph node cells or splenocytes from tumor-bearing mice. (B) Schematic of B3Z cell activation by antigen presentation. (C-E) B3Z cell activation after coculture with draining lymph node cells (C), non-draining lymph node cells (D) or spleen cells (E) from tumor-bearing mice treated with the various treatments. KCKO was utilized as control to KCKO-OVA to exclude the possible non-specific antigen presentation to B3Z cells. Results are expressed as mean ± SEM (5 mice per group) and analyzed by one-way ANOVA with Dunnett post-test. *, p<0.05, treated group compared with no treatment group; #, p<0.05, mFX + SBRT compared with mFX treated group. (F, G) CD11c.DTR-eGFP chimeric mice were implanted with KCKO-luc cells in pancreas and treated with mFX plus SBRT as in Figure 1. DCs were depleted by diphtheria toxin (DT). Tumor growth was analyzed by IVIS imaging twice a week. (F) Representative image on day 14 after tumor implantation. (G) Tumor growth curve based on IVIS imaging. Results are expressed as mean ± SEM (5 mice per group) and analyzed by one-way ANOVA with Dunnett post-test. *, p<0.05, mFX + SBRT compared with DCs depleted treatment group (DT+mFX+SBRT).

