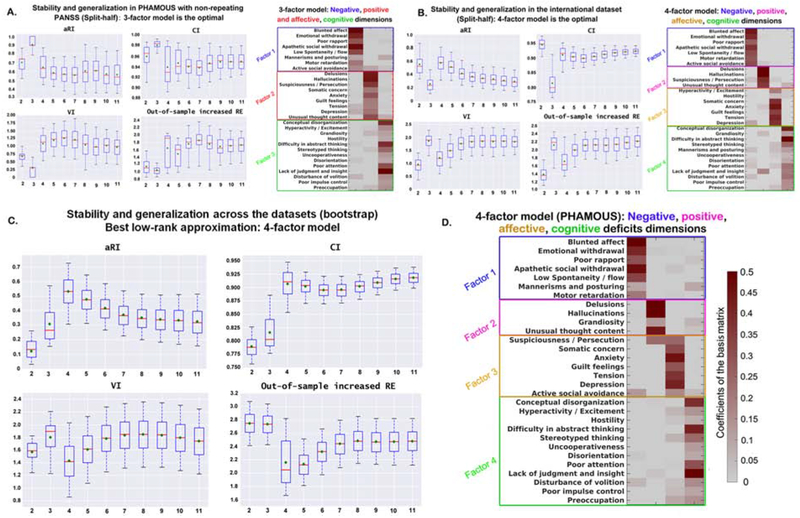
Figure 1. Split-half cross-validation (10,000 repetitions) of stability and generalizability of the factor-solutions derived by OPNMFa.
aThe three indices; aRI, VI and CI demonstrate the factor stability, while out-of-sample increased RE reflects the performance of generalizability. Box-plots show stability and generalizability results of the factor solutions. Higher values for aRI and CI (upper row) indicate higher stability. Lower values for VI and out-of-sample increase in RE (bottom row) indicate better stability and generalizability, respectively. For the box-plots, the red line depicts the median, the green diamond depicts the mean, and the whiskers represent the 5th and 95th percentiles. For the factor-models, the weight of an item in assigning to a specific psychopathological factor (columns of the matrix) is color coded according to the coefficients by a heat color map, from grey (minimum) to dark red (maximum). aRI, adjusted Rand index; VI, variation of information; CI, concordance index; RE, reconstruction error. Panel A) shows the best factor solution derived from the PHAMOUS data (1545 patients). According to the four aforementioned evaluation indices, a three-factor model was indicated as the best since both of the mean and median values for VI and out-of-sample increase in RE achieve the lowest, and the aRI and CI reach the highest at that point. Panel B) shows the best factor solution derived from the international sample (490 patients). As shown, four factors is the optimal solution, as mean and median values of VI and out-of-sample increase in RE achieve the local minimum, while the aRI reaches maxima and the CI reaches a local maximum. Panel C) shows the best factor solution identified by the bootstrap comparison of the two datasets (PHAMOUS vs. international). As shown, a four-factor solution is optimal, as the mean and median values of adjusted RI and CI reach the maximum, while the mean and median values of VI and median value of out-of-sample increase in RE achieve the minimum. Panel D) shows the most stable and generalizable four-factor structure derived from the PHAMOUS sample, serving as the best basis for future studies. This four-factor model consists of a negative (factor 1), a positive (factor 2), an affective (factor 3), and a cognitive (factor 4) factor which were named based on the items they contained.

