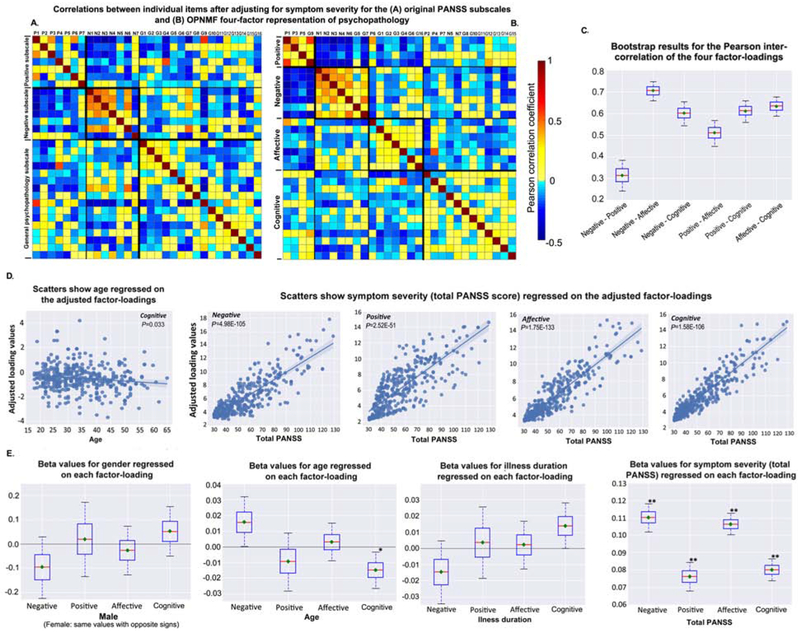
Figure 2. Inter-item correlations, relationship between factors, socio-demographic and clinical informationa.
aThe four-factor structure, derived from the PHAMOUS sample with initial measure of PANSS scores, was adopted as the reference on which the international sample was projected to derive the factor-loadings. Heat maps A-B) show inter-item correlations for (A) the original PANSS subscales, and (B) the current OPNMF four-factor representation of psychopathology after controlling for symptom severity (total PANSS score). Correlation strength is color-coded (light yellow to red: positive correlations; cyan to blue: negative correlations). Box-plot C) shows the bootstrap results (repeated 10,000 times) for the Pearson correlations between the four factor-loadings. Bootstrap samples were drawn with replacement from the original international sample, and then the correlation analysis was done on them. The red line depicts the median, the green diamond depicts the mean, and the whiskers represent the 5th and 95th percentiles. Graphs D-E) show effects of socio-demographic and clinical features on the four factor-loadings. D). Scatter plots show 4-way ANOVA results of the significant negative association between age (adjusted for gender, illness duration, and total PANSS score) and the cognitive loading (p = .033), as well as the significant positive associations between the symptom severity (total PANSS score) and the four factor-loadings (negative: p = 4.98E-105; positive: p = 2.52E-51; affective: p = 1.75E-133; cognitive: p = 1.58E-106) after adjusting for age, gender, and illness duration. Regression lines are depicted with a 95% confidence interval on the fitted values. E) shows bootstrap results for the 4-way ANOVA analysis. Bootstrap samples were drawn with replacement from the original international sample and then the ANOVAs were done on them. Boxes refer to the beta values. The red line depicts the median, the green diamond depicts the mean, and the whiskers represent the 5th and 95th percentiles.* (Mdn, p < .05), ** (M and Mdn, p < .05).

