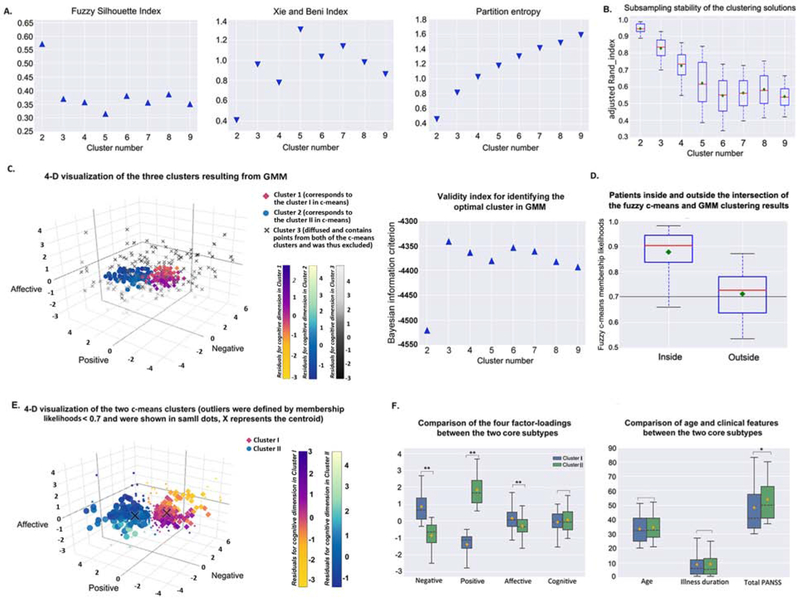
Figure 3. Fuzzy c-means clustering results of patient subgroups based on the loadings of the generalizable four-factor structurea.
aPanel A) shows the internal validity indices used for determining the optimal cluster number. Higher values of FSI (in triangle) and lower values of XB and PE (in inverted triangle) indicate a better clustering quality. The maximum for FSI and the minimums for XB and PE all suggested a two-cluster solution. FSI and XB reflect the compactness and separation of the generated clusters, while PE reflects the fuzziness of the cluster partition, i.e., the uncertainty of the patients to be assigned to a certain cluster. Box-plot B) shows results of the assessment of clustering stability based on the subsampling technique. The cluster number two reaches the highest aRI. aRI reflects the convergent assignment of the patient-pairs to the clusters between the sub-samples and the original sample. C) Four-dimensional visualization of the optimal three GMM clusters determined by the Bayesian information criterion (a higher value indicates a better clustering solution). Magnitude of the cognitive loading was color-coded differently for the three clusters (cluster 1, corresponds to the cluster I (i.e., subtype A) in fuzzy c-means, yellow to Modena; cluster 2, corresponds to the cluster II (i.e., subtype B) in fuzzy c-means, blue to shallow flaxe; cluster 3, i.e., the excluded diffused cluster which would not present any specific subtype, black to light grey). Boxplot D) shows the fuzzy c-means membership likelihoods of the patients inside and outside the intersection of the c-means and GMM clustering results. The black line indicates a heuristic cutoff of 0.7. Panel E) shows a four-dimensional visualization of the optimal fuzzy c-means two-cluster solution. Ambiguous assignments were defined by membership likelihoods < 0.7, which was selected by interacting with GMM. Those subtype ambiguous patients are shown in small dots, X represents the centroid. Magnitude of the cognitive loading is color-coded differently for the two clusters (cluster I, yellow to Modena; cluster II, blue to shallow flaxe). Grouped box-plots F) show the between-subtype (without subtype ambiguous patients) comparison results of the four factor-loadings, age, illness duration, and total PANSS score. Cluster I is dominated by negative and affective symptoms (i.e., subtype A), cluster II is significantly prominent in positive symptom expressions (i.e., subtype B). The black dashed line depicts the median, the yellow diamond depicts the mean, and the whiskers represent the 5th and 95th percentiles. *p < .01; **p < .001. FSI, fuzzy silhouette index; XB, Xie and Beni index; PE, partition entropy; GMM, Gaussian mixture modeling.

