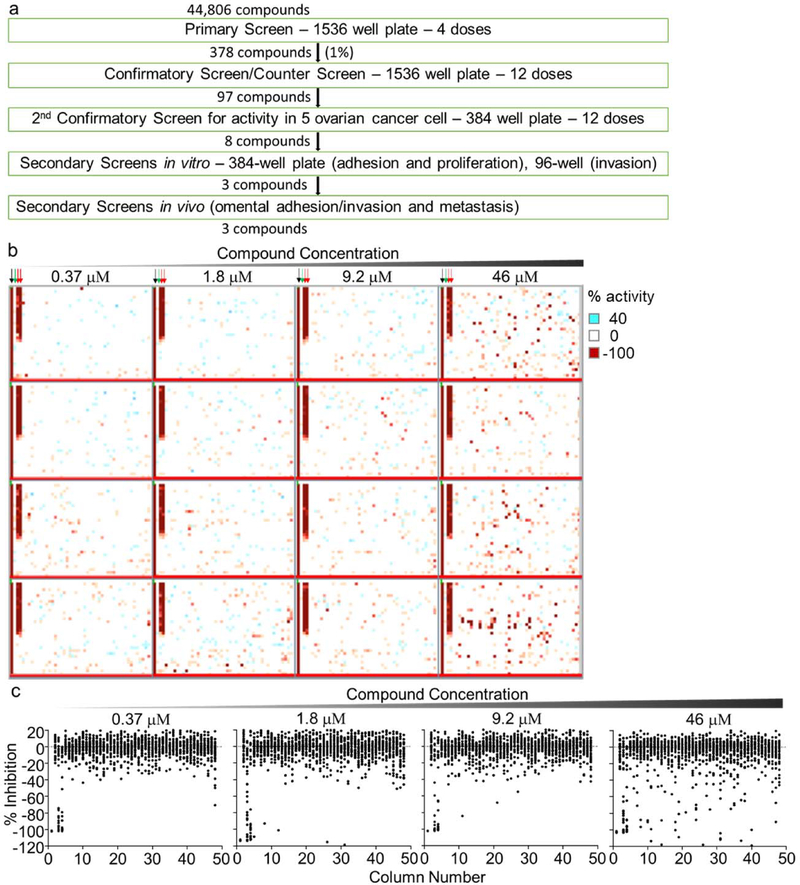
Figure 1. A 3D organotypic model used in qHTS to identify inhibitors of OvCa metastasis.
a. An outline of the screening strategy and number of active compounds after each assay. b-c. 1,536-well HTS primary screening assay (4-dose response). Adhesion and invasion of fluorescently labelled (GFP) SKOV3ip1 cells to the 3D organotypic model (16h) was measured using a fluorescence cytometer. b. Representative images of the four compound plates are shown. Inhibition of adhesion/invasion depicted in red; no activity in white. The controls, no cancer cells added (−100% inhibition, black arrow) dimethyl sulfoxide (0 % inhibition, green arrow) and Tomatine (pharmacological control, red arrows) are shown c. Scatter % inhibition plots of the assay plates for the four compound doses tested. Active compounds were selected using a combination of parameters including curve response, class scoring, maximum response, efficacy and compound concentrations that give half-maximal response values (EC50).

