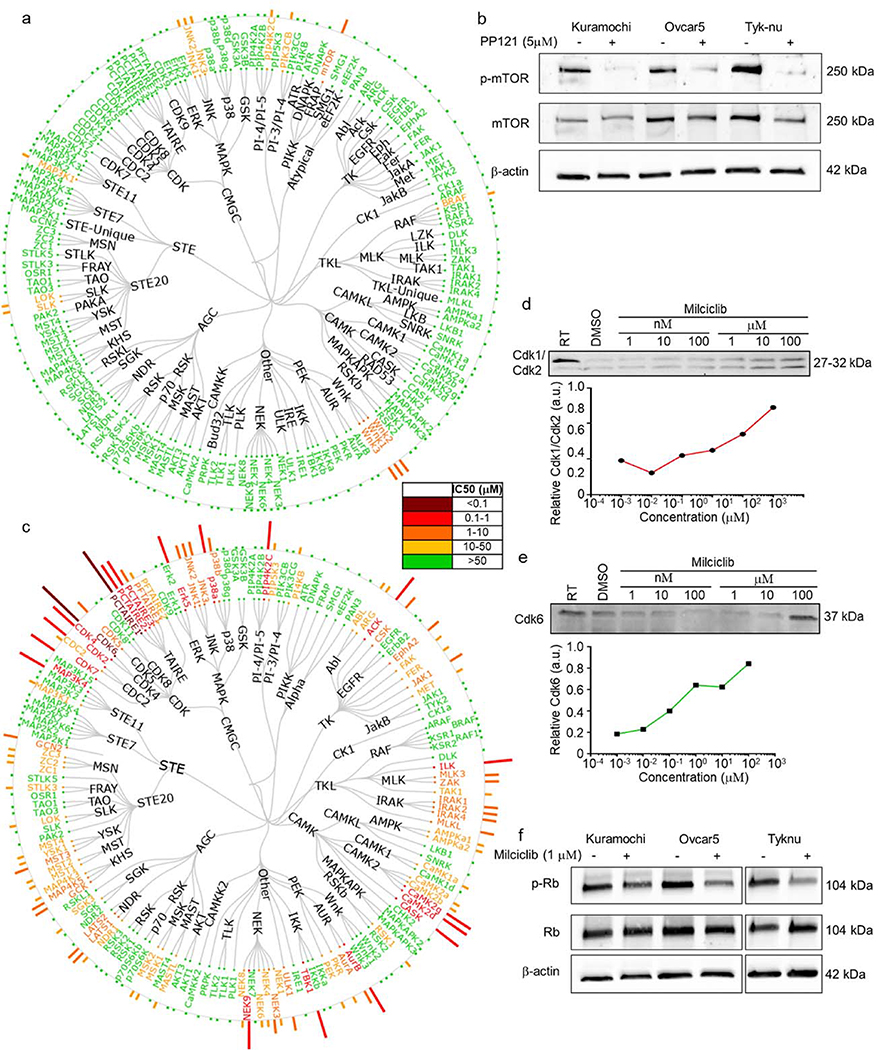
Figure 5. Kinase selectivity profile of PP-121 and Milciclib in ovarian cancer cells.
a. Tyk-nu cells were treated with increasing concentrations of PP-121 for 16h, and in situ kinase profiling performed. Dendrogram representation of kinase inhibitor activity. Potency depicted by length of the bar for each kinase, and color code for concentration active. b. Immunoblot analysis of phosphorylated and total mTOR after PP121 (5 μM) or DMSO control treatment for 24 hours in Kuramochi, Ovcar5 and Tyk-nu cells. DMSO, dimethyl sulfoxide. c. Tyk-nu cells were treated with increasing concentrations of Milciclib for 16h, and in situ kinase profiling performed. Dendrogram representation of kinase inhibitor activity. Potency depicted by length of the bar for each kinase, and color code for concentration active. d-e. Cellular thermal shift assays of Cdk1/Cdk2 (d) and Cdk6 (e) with increasing concentrations of Milciclib (1 nM to 100 μM). f. Immunoblot analysis of phosphorylated and total retinoblastoma (Rb) after Milciclib (1 μM) or dimethyl sulfoxide (DMSO) control treatment for 24 hours in Kuramochi, Ovcar5 and Tyk-nu cells. RT, room temperature.

