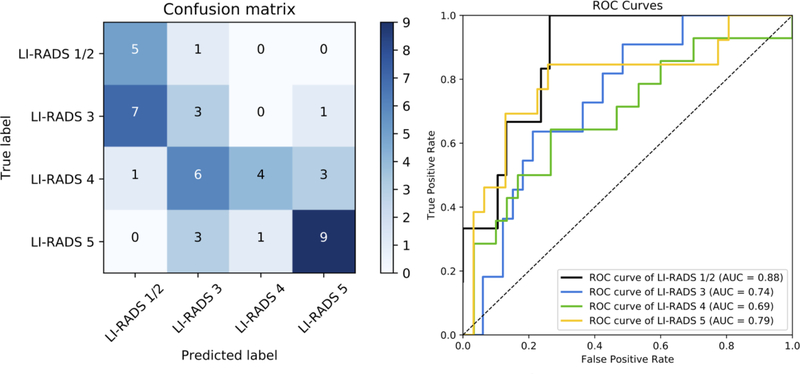
Fig. 4.
Left panel: Confusion matrix for the transfer learning model on the EXT-MR external test set, which shows the number of observations for each combination of ground truth and predicted LI-RADS category. The numbers of correct categorization are on the diagonal line from the top-left triangle to the bottom-right triangle. Wrong decisions due to overcategorization are in the bottom-left triangle, and wrong decisions due to undercategorization are in the top-right triangle. Right panel: An ROC diagram with corresponding AUCs for transfer-learned model on the EXT-MR external test set. An ROC curve was created for each LI-RADS category versus all other categories by sweeping a threshold over the predicted probability of the particular LI-RADS category (right).
Abbreviations: AUC, area under the curve; LI-RADS, the Liver Imaging Reporting and Data System; ROC, receiver operating characteristic curve

