
Figure 3.
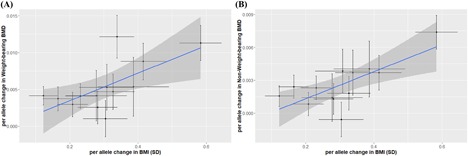
MR‐Egger regression plots for BMI and BMD in weight‐bearing (A) and non–weight‐bearing bones (B). Results from MR‐Egger regression analysis to assess horizontal pleiotropy are presented. Blue line represents the MR‐Egger regression estimate for the association between BMI and BMD in weight‐bearing (A) and non–weight‐bearing bones (B). For both sites, the y‐intercept estimates were not significantly different from zero (weight‐bearing bones: = 0.001, p = 0.55; non–weight‐bearing bones: = –0.004, p = 0.67), suggesting that there is no horizontal pleiotropy.