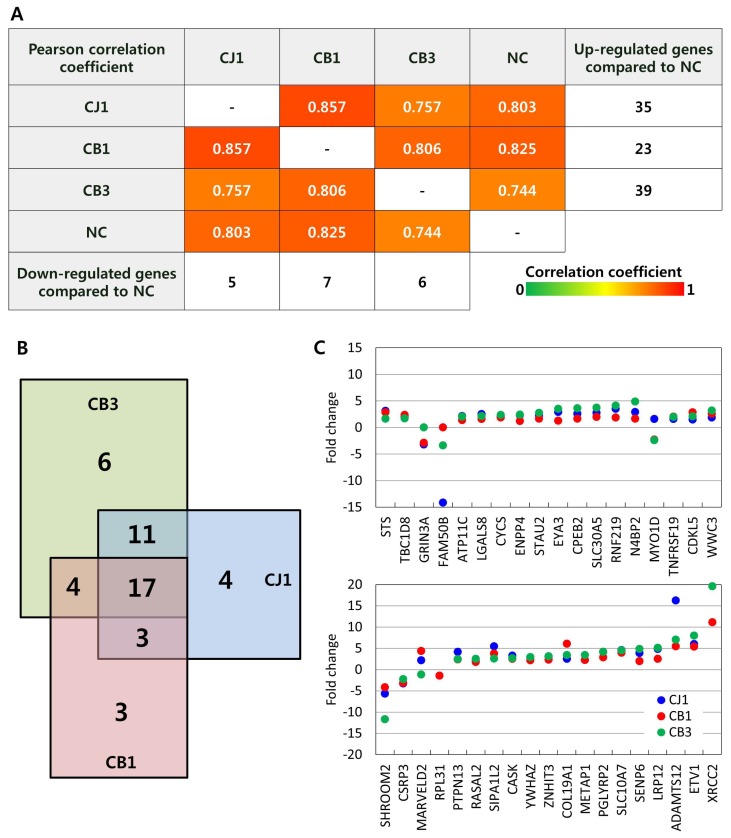
Figure 3.
Global gene expression of GGTA1 knockout Yucatan miniature pigs. (A) Pearson correlation coefficient among expression profiles of GGTA1 knockout pigs and wild type strain control (NC). (B) Venn Diagram of differentially expressed genes in each GGTA1 knockout pigs compared to wild type strain control. Red square indicates differentially expressed genes observed in CB1, green in CB3, and blue in CJ1. (C) Fold changes of differentially expressed genes (fold change ≥2) observed in individual GGTA1 knockout pigs. Blue dots indicate differentially expressed genes in CJ1, red in CB1, and green in CB3 compared to wild type strain control. SNP, single nucleotide polymorphism; GGTA1, α-1,3-galactosyltransferase.

