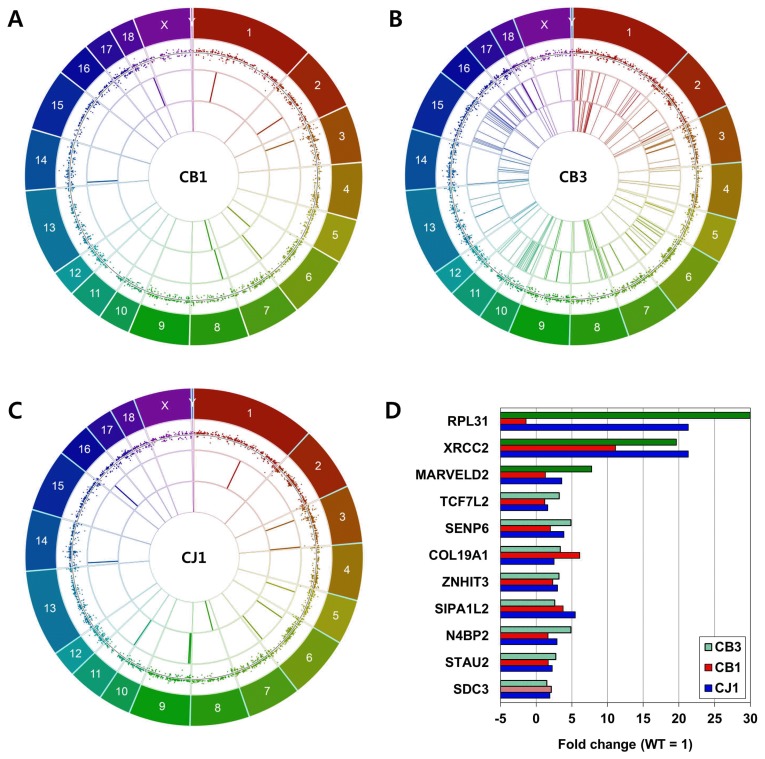
Figure 4.
Correlation between genomic mutations and gene expression. (A) Circos plot of CJ1, (B) CB1, and (C) CB3. Outer layers indicate pig reference genome Sscrofa 10.2. First inner layers indicate differentially expressed transcripts compared to wild type strain control (log2|fold change| ≥2). Horizontal lines indicate fold change = 1. Second inner layers indicate SNPs, and third inner layers indels. Quality of read sequencing ≥1,000, and total depth ≥100. (D) Gene expression associated with genomic mutations. Bars indicate fold change of gene expression compared to wild type control. Blue bars indicate relative gene expression levels in CJ1, red in CB1, and green in CB3. Expression levels of genes harboring indel were depicted in light red or light green bars, SNP in deep green bars. SNP, single nucleotide polymorphism.

