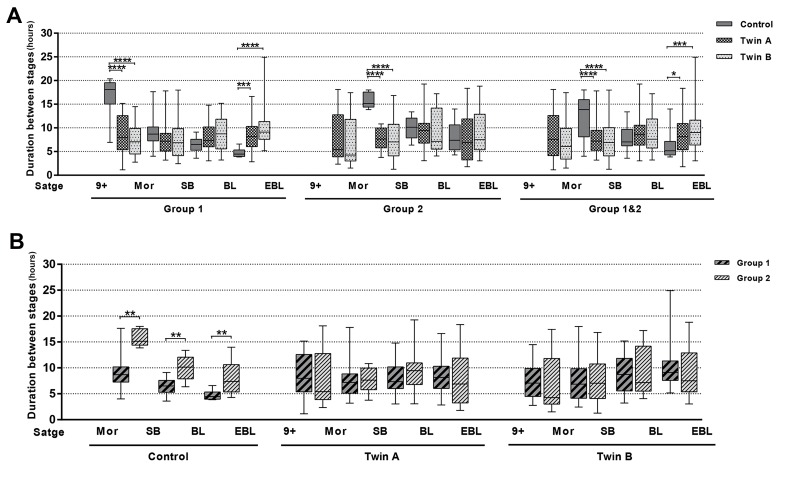
Fig 3.
Developmental dynamics of twin embryos. A. Comparison of the duration between stages for twin and control embryos within the group (group 1, 8-9 blastomeres and group 2, 10-14 blastomeres). B. Comparison of the duration between stages depending on the number of starting blastomeres in the control, twin A (donor blastomere) and twin B (recipient blastomere) embryos, separately.
9+; More than nine blastomeres, Mor; Morula or fully compacted embryo, SB; Start of blastulation, BL; Blastocyst, EBL; Expanded blastocyst, *; P≤0.05, **; P≤0.01, ***; P≤0.001, and ****; P≤0.0001.

