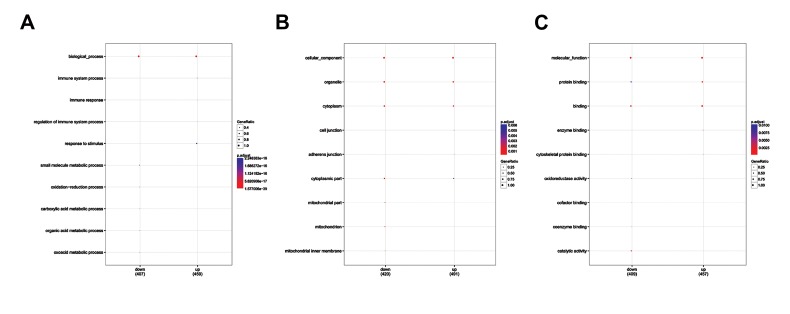
Fig 1.
GO functional enrichment analysis for DEGs between ccRCC and normal samples. A. Up- and down-regulated genes presented in top none biological processes. B. Up- and down-regulated genes presented in top eight cellular functions. C. Up- and down-regulated genes presented in top eight molecular functions. GO; Gene ontology, ccRCC; Clear cell renal cell carcinoma, and DEGs; Differentially expressed genes.

