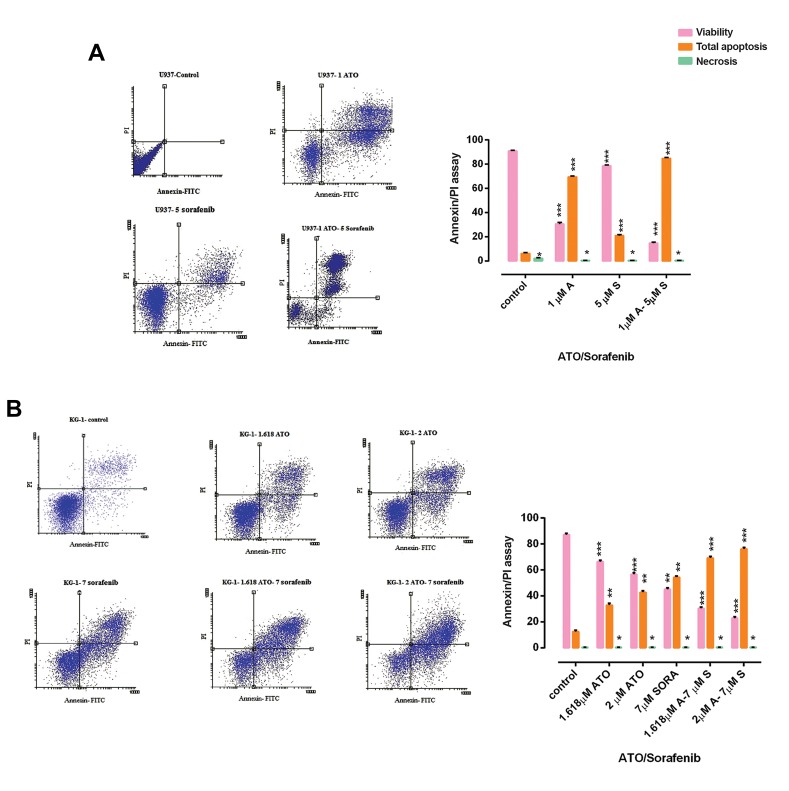
Fig 3.
The rate of apoptosis and necrosis by flow cytometry. Investigation of apoptosis in A. U937 and B. KG-1 cell lines after 48 hours. Cells in the lower right quadrant show apoptosis while in the upper right quadrant show post-apoptotic necrosis. Data are expressed as mean ± SE of three independent experiments. Statistical significance was defined at *; P<0.05, **; P<0.01 and ***; P<0.001 compared to corresponding control, by using two way ANOVA.

