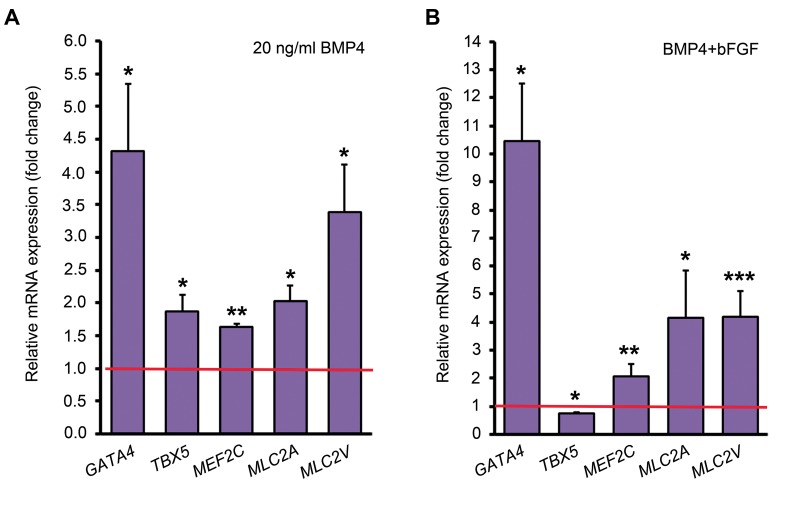
Fig 2.
Quantitative analysis of some cardiac-specific genes by comparative method. A. The expression level of each gene in the control group (untreated ADSCs) has been assumed 1 (indicated by the red line) and its expression in BMP4 treatment group was compared to that and B. The expression level of each gene in the BMP4 treatment group has been assumed 1 (indicated by the red line) and its expression in BMP4 plus bFGF treatment group was compared to that. *; P<0.05, **; P<0.01, ***; P<0.001 (Pair Wise Fixed Reallocation Randomization Test® performed by REST 2009 software), ADSCs; Adipose tissue-derived stem cells, BMP4; Bone morphogenetic protein 4, and bFGF; Basic fibroblast growth factor.

