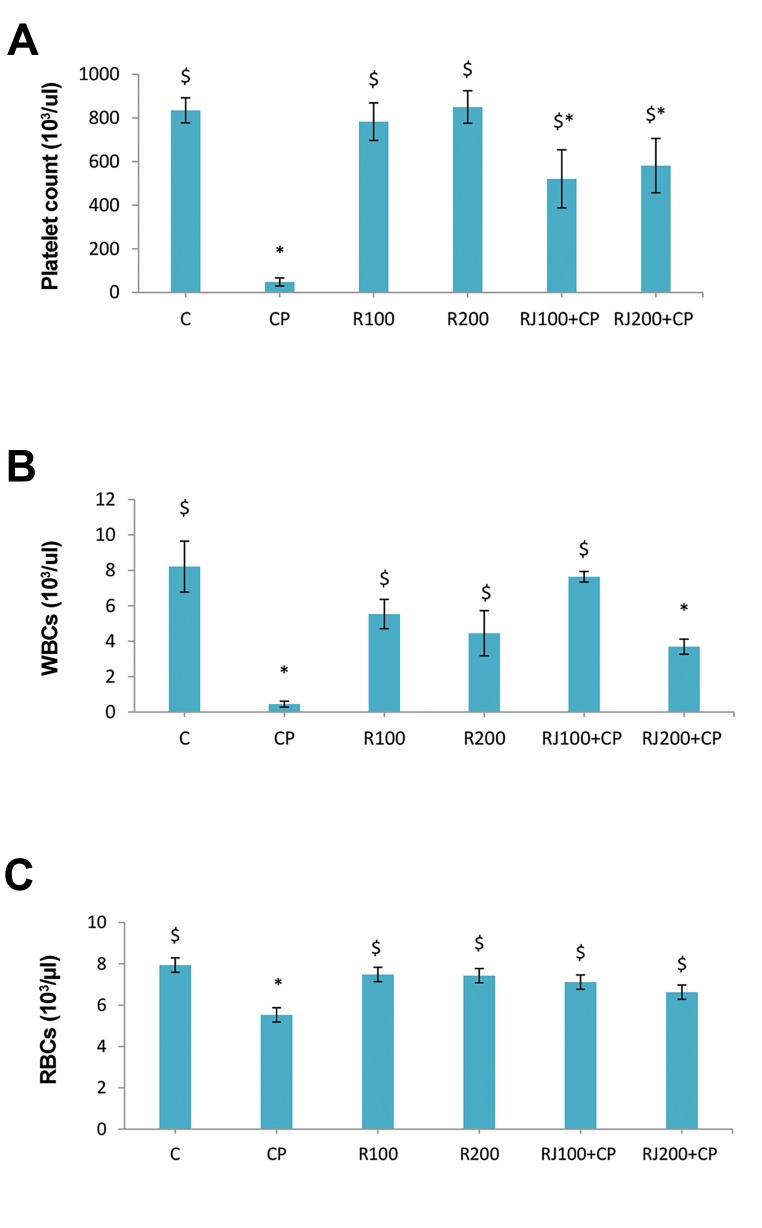
Fig 1.
Changes of blood cells in different groups. RJ pretreatment and CPinduced changes in the number of A. PLT, B. WBCs, and C. RBCs. Data are represented as the mean ± SE (n=8). *; Significant (P<0.05) difference vs. the control group, $; Significant (P<0.05) difference versus the CP group, C; Control, CP; Cyclophosphamide, R; Royal Jelly, PLT; Platelets, WBC; White blood cell, and RBC; Red blood cell.

