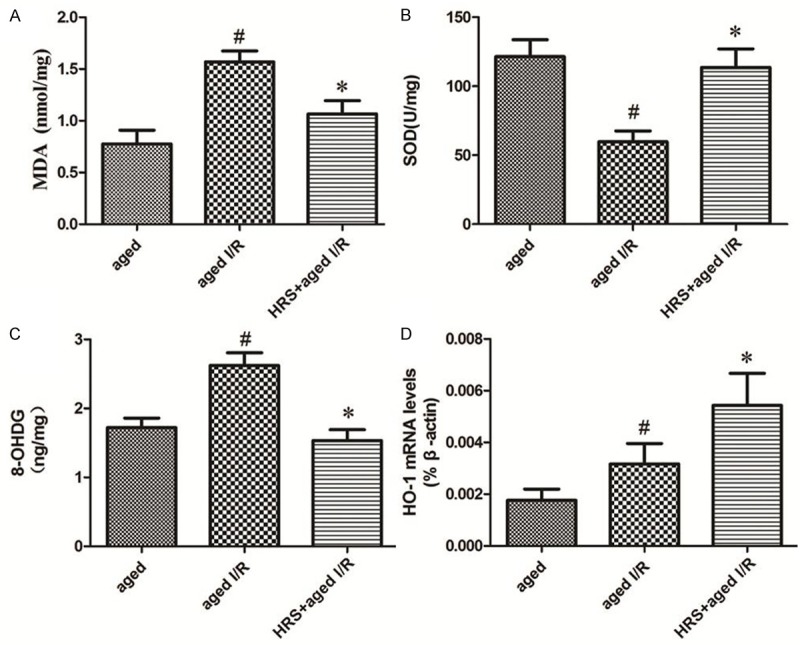
Figure 1.

Markers of oxidative stress in the different treatment groups. A. MDA level in the kidneys of different groups (n = 10). Data are expressed as mean ± SD. *P < 0.05 vs. the aged I/R group; #P < 0.05 vs. the aged group. B. 8-OHdG level in the kidney in different groups (n = 10). Data are expressed as mean ± SD. *P < 0.05 vs. the aged I/R group; #P < 0.05 vs. the aged group. C. SOD activity in the kidney of different groups (n = 10). Data are expressed as mean ± SD. *P < 0.05 vs. the aged I/R group; #P < 0.05 vs. the aged group. D. mRNA level of HO-1 in the kidney of different groups (n = 10). Data are expressed as mean ± SD. *P < 0.05 vs. the aged I/R group; #P < 0.05 vs. the aged group.
