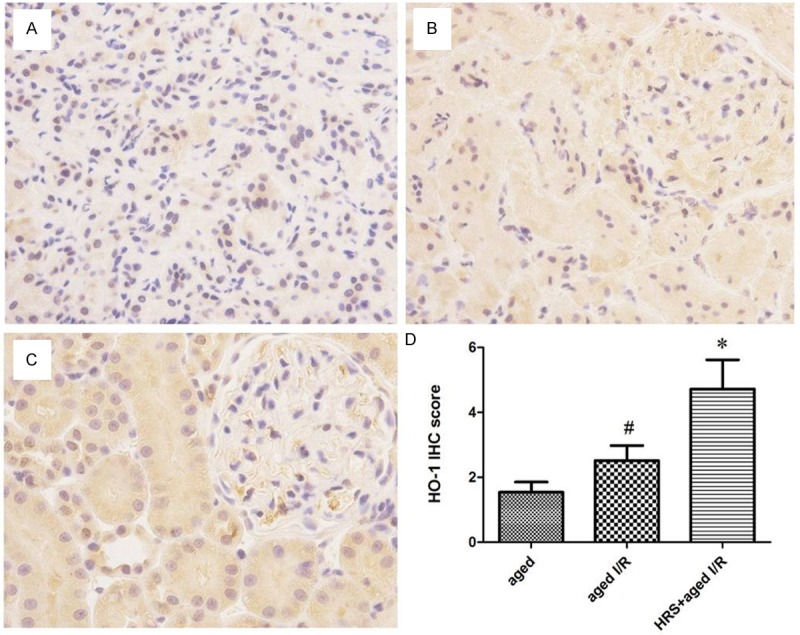
Figure 3.

HO-1 expression in the kidneys from different treatment groups. A-C. Representative HO-1 staining of specimens from the aged group, aged I/R group, and aged I/R + HRS group. Original magnification: 400×. D. Immunohistochemistry score for HO-1 staining in different groups (n = 10). Data are expressed as mean ± SD. *P < 0.01 vs. the aged I/R group; #P < 0.01 vs. the aged group.
