
Figure 1.
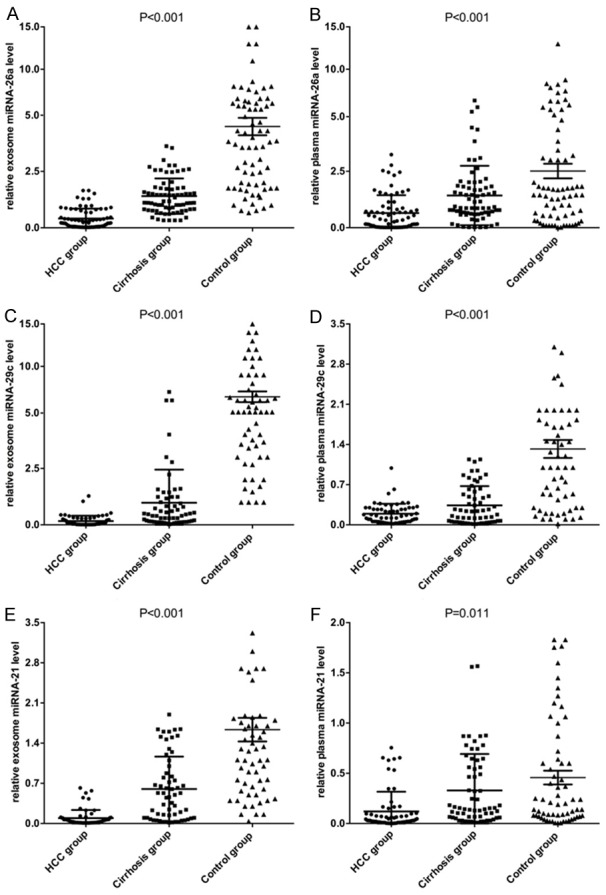
Comparing expression levels of miRNA-26a (A, B), miRNA-29c (C, D) and miRNA-21 (E, F) in both plasma and exosomes among three groups.
Official websites use .gov
A
.gov website belongs to an official
government organization in the United States.
Secure .gov websites use HTTPS
A lock (
) or https:// means you've safely
connected to the .gov website. Share sensitive
information only on official, secure websites.
Comparing expression levels of miRNA-26a (A, B), miRNA-29c (C, D) and miRNA-21 (E, F) in both plasma and exosomes among three groups.