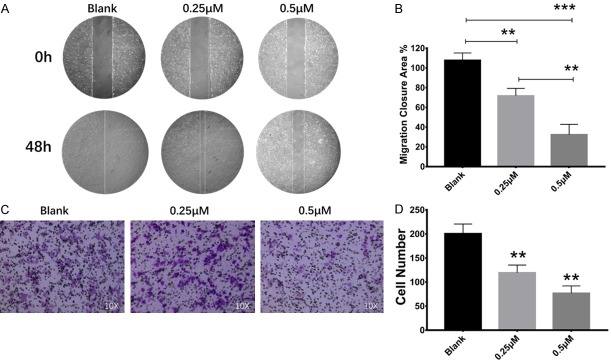
Figure 4.
PQ401 inhibited U2OS cell migration at low concentration. A. Wound healing assay: 0 h picture represents starting point of wound gap. The 48 h picture represents final migration status. The front line was marked with white. B. Statistical result of migration closure area compared with starting point. C. Transwell assay: the migrated cells were stained in crystal violet and counted using ImageJ. D. Statistical results of transwell assay compared with negative control (Blank). (*P<0.05; **P<0.01; ***P<0.001).

