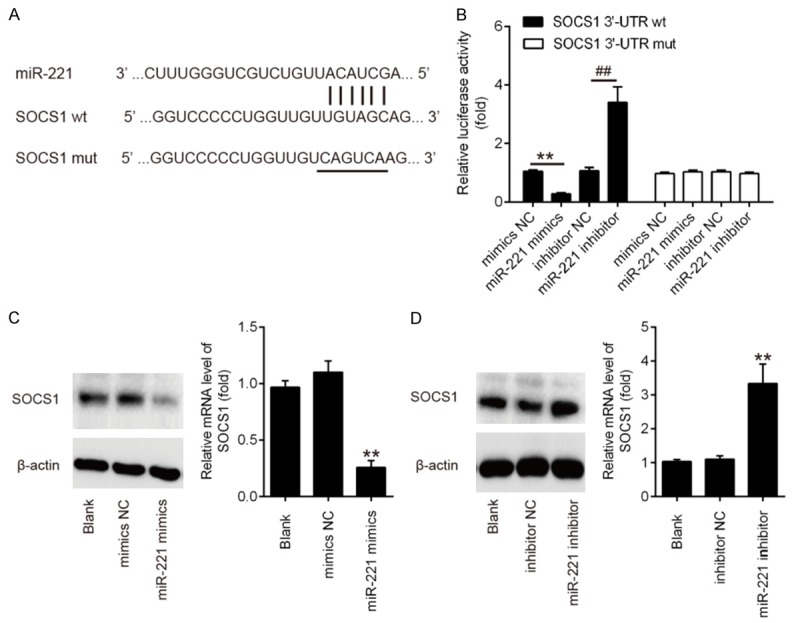
Figure 5.

SOCS1 is a direct target of miR-221. A. Schematic diagram of the predicted target sites of miR-221 in SOCS1 3’-UTRs. The predicted target sites are underlined and mutated as indicated. B. Luciferase assay of 293 cells co-transfected with firefly luciferase constructs containing the SOCS1 wild-type or mutated 3’-UTRs and miR-221 mimic, mimic NC, miR-221 inhibitor or inhibitor NC, as indicated (n = 3). Data represent the mean ± SD of three independent experiments. **P < 0.01 vs. mimic NC, ##P < 0.01 vs. inhibitor NC. C, D. The expressions of SOCS1 mRNA and protein after transfection with miR-221 mimic or miR-221 inhibitor were measured by qRT-PCR and western blot. Data represent the mean ± SD of three independent experiments. **P < 0.01 vs. mimics NC or inhibitor NC.
