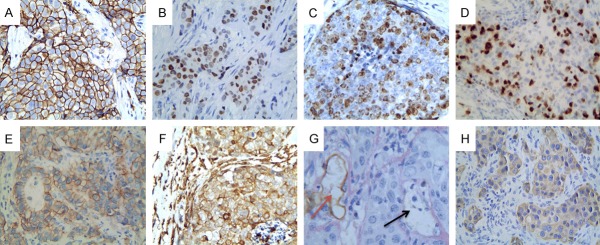
Figure 1.
Expression of the proteins in TNBC (×400 magnification). (A) Representative case that shows positive staining for EpCAM (A), Slug (B), Twist1 (C), ZEB1 (D), E-cadherin (E) Vimentin (F) and VE-cadherin (H); (G) Positive staining of VM in the TNBC tissue (black arrow is VM structure, red arrow is vessel).

