Figure 1.

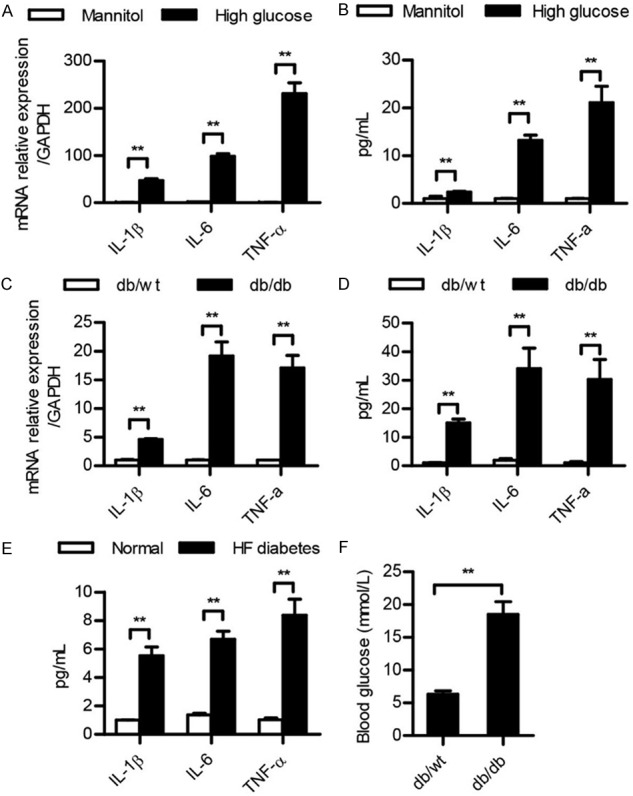
The levels of IL-1β, IL-6, and TNF-α were significantly increased in T2DN. (A-E) qRT-PCR and ELISA analysis of IL-1β, IL-6, and TNF-α in podocytes treated with mannitol or high glucose for 48 h (A and B), or in db/wt mice kidney (C and D) and serum of HF diabetes mice (E). The results were presented as a fold expression of IL-1β, IL-6, and TNF-α mRNA to that of β-actin. (F) Blood glucose levels were measured after db/wt and db/db mice were fed for 20 weeks. Data are shown as the means + SD. n = three independent experiments. **P < 0.01.
