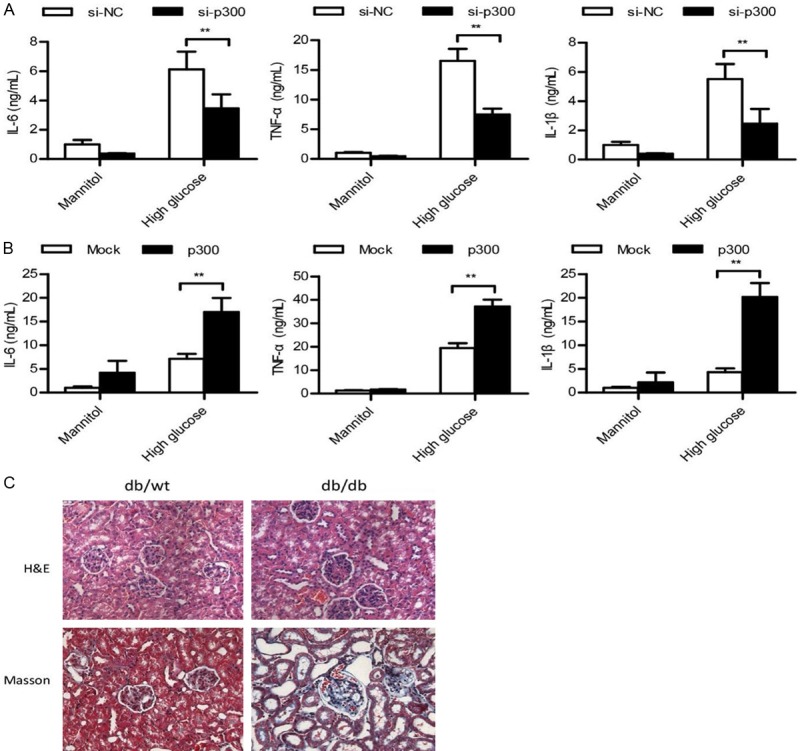
Figure 3.

p300 significantly promoted the inflammatory response in T2DN. (A and B) ELISA analysis of IL-1β, IL-6, and TNF-α in podocytes transfected with si-NC or si-p300 for 36 h (A) or transfected with Mock or p300-His plasmid (B) stimulated with mannitol or high glucose for 48 h, or in db/wt mice kidneys. (C) H&E or Masson’s Trichrome analysis of kidney tissue in db/wt or db/db mice. Data are shown as the means + SD. n = three independent experiments (A and B). Similar results were obtained in three independent experiments (C). **P < 0.01.
