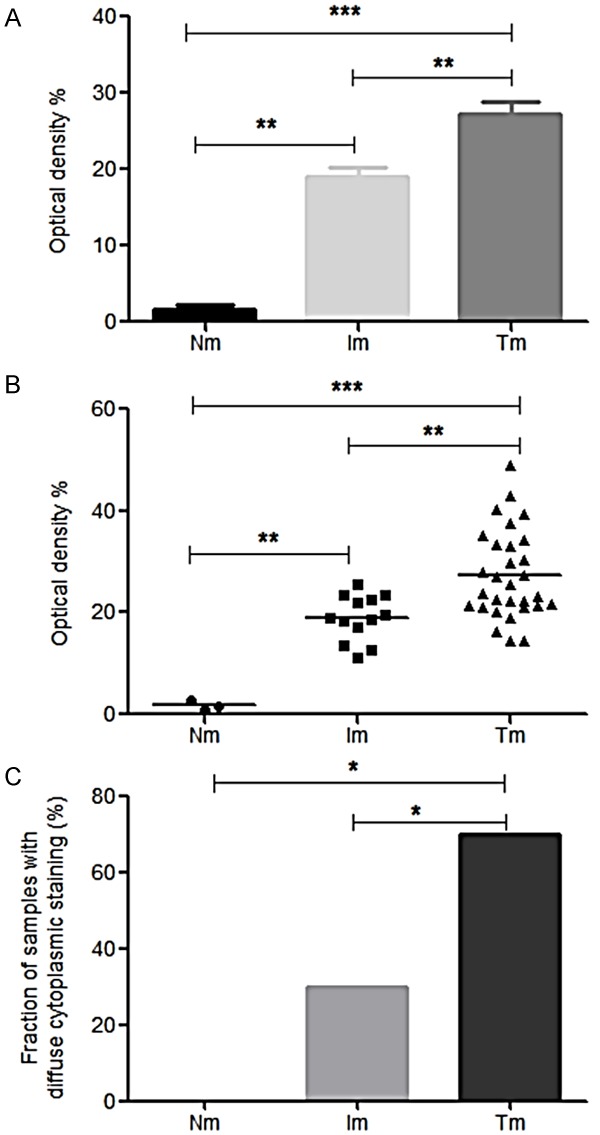
Figure 2.

Quantitative assessment of MUC1 expression in healthy and pathologic colon mucosa. (A) Quantification of MUC1 expression in normal (“Nm”), IBD (“Im”) and tumorous CRC (“Tm”) biopsies by determination of mean optical intensity. From each biopsy of the respective groups, staining intensities (optical densities) for 6 arbitrarily selected microscopic fields, (× 40 objective) were determined as detailed in the Material and Methods section. Error bars represent standard deviations (± SEM). Significance was determined by the Tukey’s multiple comparisons test (GraphPad PRISMA 7.0) computer program) **: P ≤ 0.01, ****: P ≤ 0.0001. Average optical densities were included only for samples,positive here mean presenting immunoreactivity under microscope (B) Distribution of MUC1 immunostaining intensity within the investigated groups of normal and diseased colon mucosa specimens (designation of groups, methodology and statistics as in (A)). Bars represent the respective median values. (C) Analysis of subcellular distribution of MUC1 in the groups of colon mucosa specimens under study. The percentage of staining in the cytoplasmic compartment was determined for all specimens investigated by microscopic estimation and expressed as percentage of total cells. Significance was determined by Fisher exactitude test, *: P ≤ 0.05.
