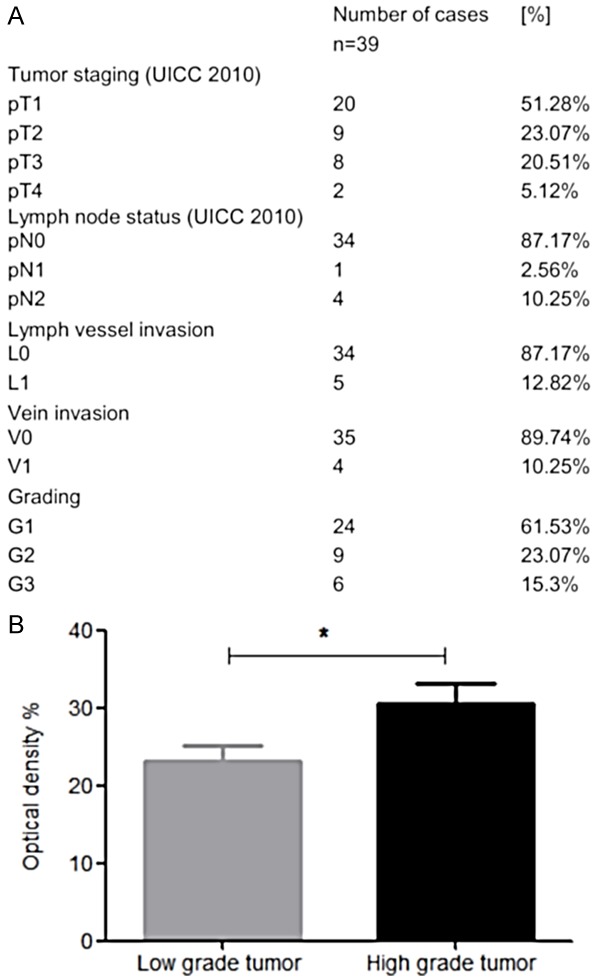
Figure 3.

Association of MUC1 expression levels with CRC tumor grade. (A) Clinicopathologic parameters of CRC samples investigated in this study. (B) Comparison of MUC1 expression intensity in biopsies obtained from low grade and high grade CRC tumors. “Low grade tumor” refers to the G1 cases (n=24), “High grade tumor” to the combined G2 and G3 cases (n=15) from (A). Acquisition and presentation of data and statistics is as in Figure 2A; *: P ≤ 0.05.
