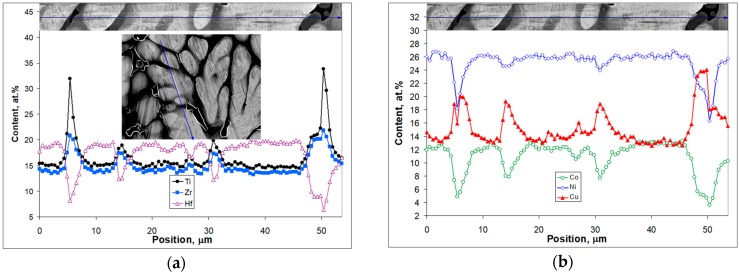
Figure 4.
SEM images using back-scattered electron contrast and corresponding EDX line scan analysis for as-cast Ti16.67Zr16.67Hf16.67Co10Ni25Cu15: (a) Ti (closed circles), Zr (closed rectangles), Hf (open triangles) concentration profiles along the line shown in the upper inset; the central inset displays an overview of the microstructure along with line that is also shown in the upper inset; (b) Co (opened circles), Ni (opened rectangles), Hf (closed triangles) concentration profiles along the line shown in the upper inset.

