
Figure 3.
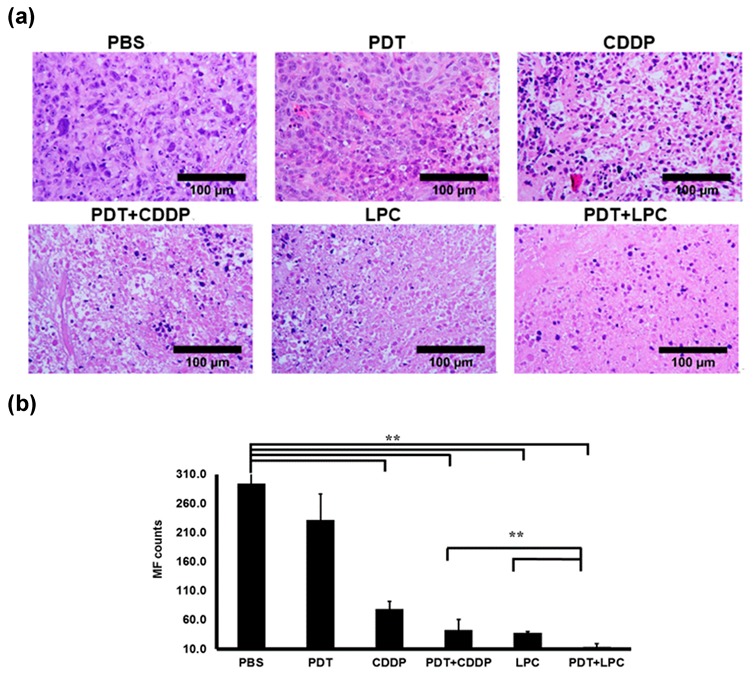
Hematoxylin and Eosin staining of tumor tissues. (a) H&E staining showed the tissue morphology of tumor treated mice. (b) quantification of mitotic Figure (MF) count for tumor tissues of each group. Results are shown as mean ± SD; scale bar means 100 µm, 40× magnification, ** p < 0.001, n = 5 for each. CDDP, Encapsulating cisplatin; PBS, phosphate buffered saline.