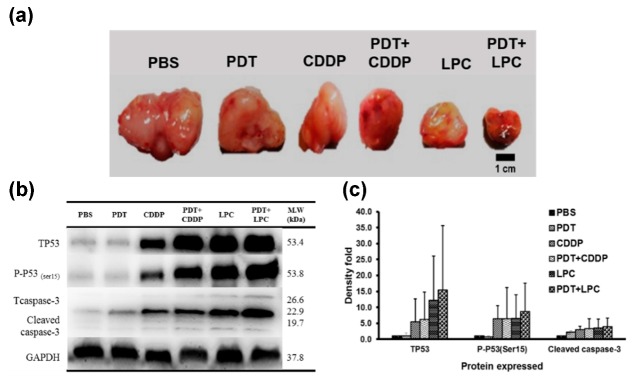
Figure 5.
Western blot analysis. (a) excised tumor of each group; (b) protein expression post treatment in response to P53 (DNA damage), P53 phosphorylation of serine 15 (cell cycle arrest), cleaved caspase-3 (apoptosis) and GAPDH as a housekeeping protein for internal control; (c) the average quantification of protein expression from each group; Column indicates mean and bar indicates SD (n = 3).

