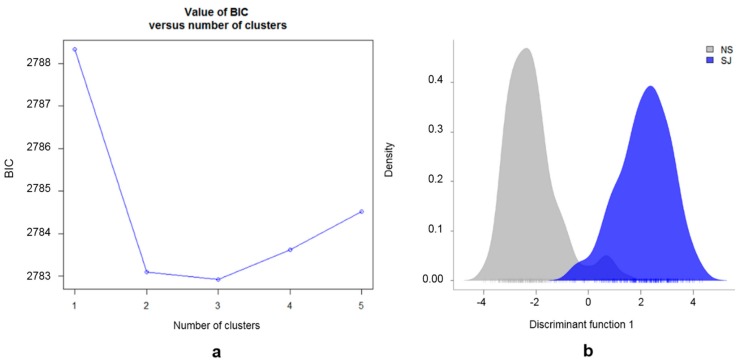
Figure 4.
Genetic structure of SWB horses. (a) Inference of the number of clusters in SWB horses from analysis of genotype data based on K–means algorithm; (b) Density plot of individuals along the first discriminant function from the discriminant analysis of principal component (DAPC) for the two defined SWB subpopulations divided by EBVs for show jumping performance. The gray peak represents the non-show jumping horses (NS) and the blue peak represents the show jumping horses (SJ).

