Figure 2.
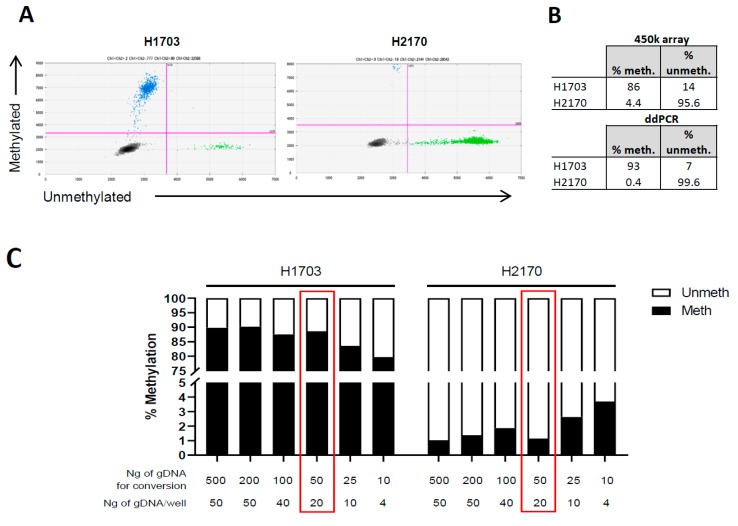
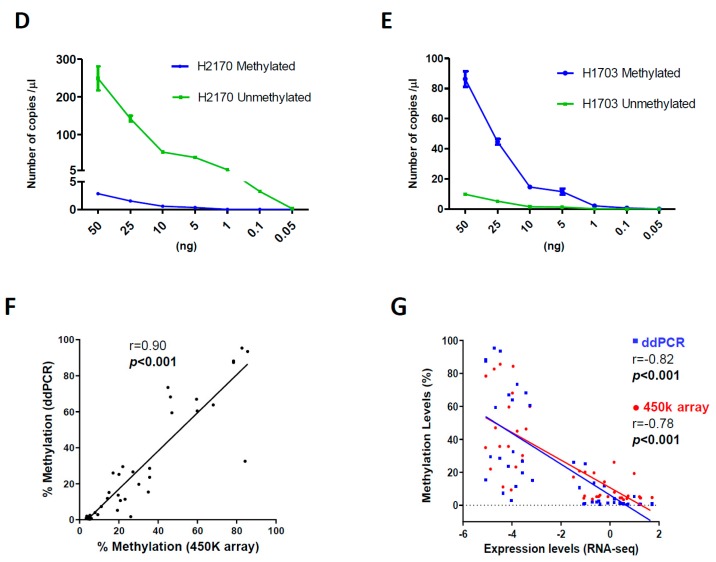
Optimization of conditions for TMPRSS4 methylation analysis by ddPCR and evaluation of methylation status in lung cancer cell lines. (A) Representative two-dimensional (2D) ddPCR plots of number of methylated (blue) and unmethylated (green) events in the cell lines H1703 and H2170. (B) Percentages of methylated/unmethylated copies in the cell lines selected as controls (H1703 and H2170). (C) Assessment of the amount of DNA for bisulfite conversion and for loading that is necessary for an accurate quantification. The expected percentage of methylated and unmethylated DNA was maintained when at least 50 ng of DNA was converted and 20 ng was loaded. (D,E) Dilution assays in H2170 and H1703. Upon bisulfite conversion of 50 ng of DNA, serially diluted DNA (indicated in the X-axis) was loaded. (F) Methylation status of the TMPRSS4 promoter in a panel of 46 lung cancer cell lines, using 50 ng of DNA as the starting amount and 20 ng for loading. A very significant correlation between ddPCRs and data from the 450k methylation array was found. (G) Inverse correlation between methylation status (450k in red and ddPCR in blue) and expression of TMPRSS4 in the lung cancer cell panel.


