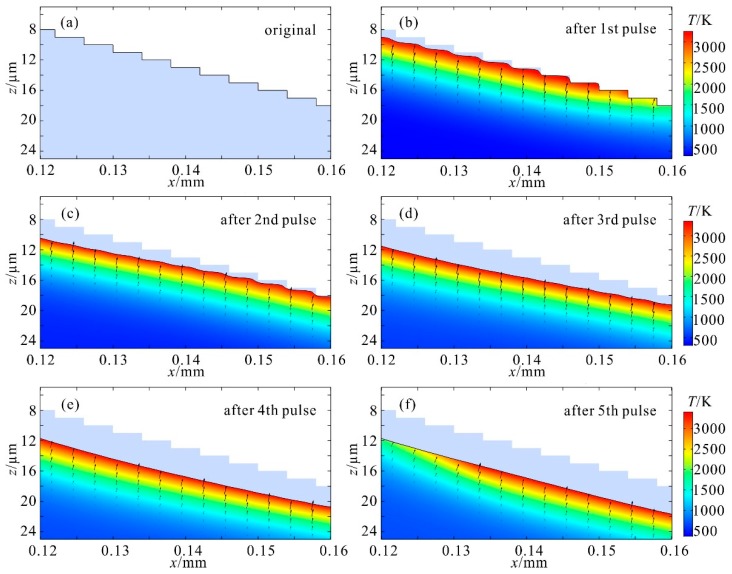
Figure 4.
A morphological evolution and temperature profile during a complete polish process (fr = 1 kHz, τ = 10 µs, di = 20 µm). (a) The original multilevel structure; surface profile at the end of the (b) first, (c) second, (d) third, (e) fourth, and (f) fifth pulses, compared with the original shape in light purple in each figure. Color maps in (b–f) are temperature profiles.

