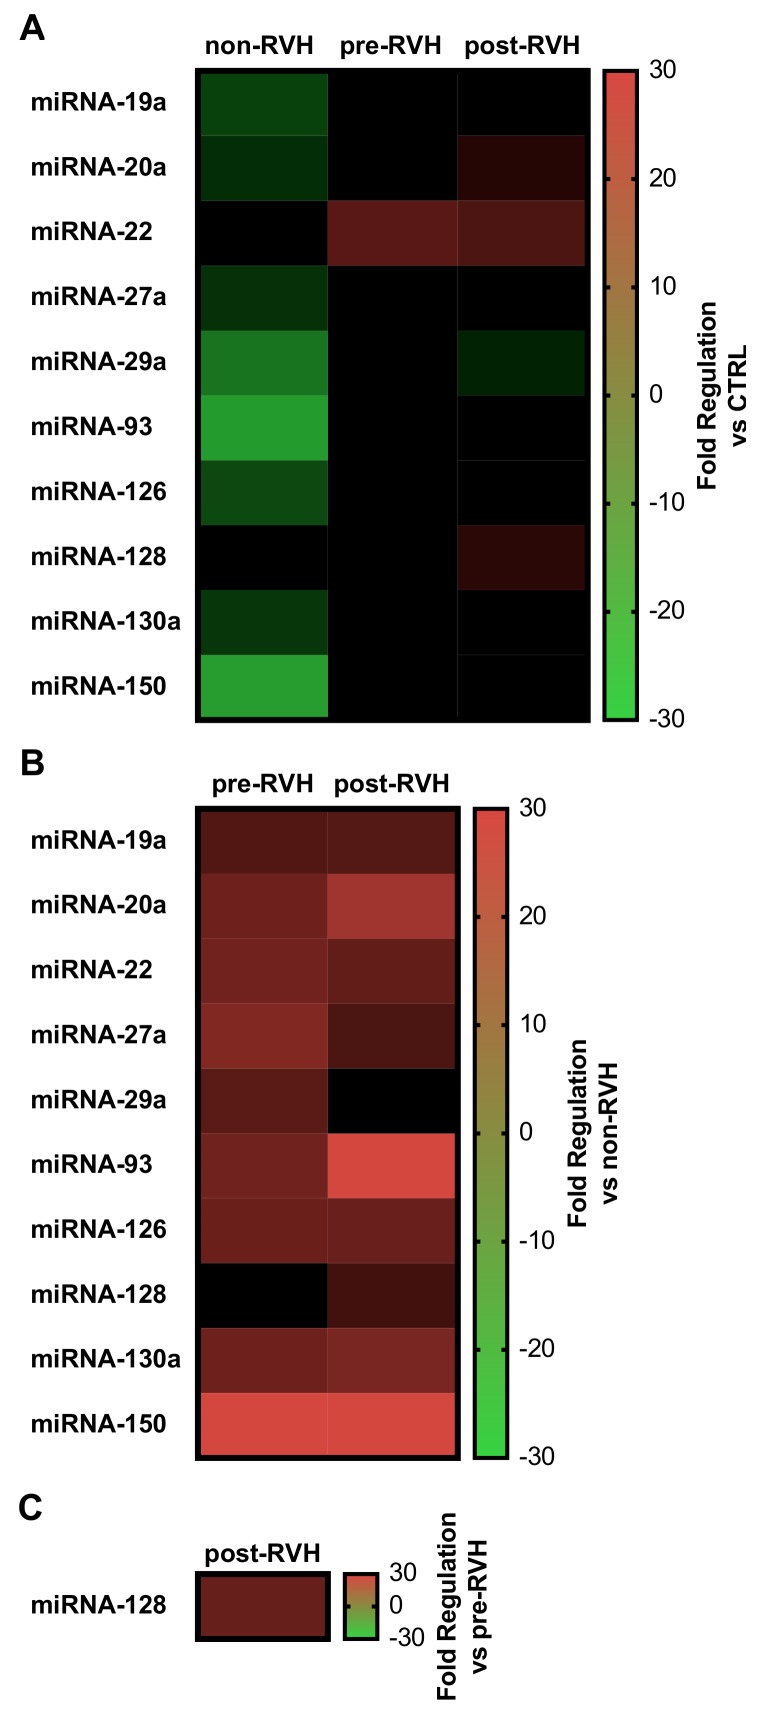
Figure 3.
Heatmaps of relevant angiogenic miRNA expression in PDR vitreous. Relative fold regulation from pooled vitreous from the controls (CTRL), non-RVH, pre-RVH, and post-RVH were analyzed by the ΔΔCt method and displayed as comparative matrixes versus CTRL (A), versus non-RVH (B), or versus pre-RVH (C). For comparison, the scale was normalized and represented as positive values for upregulated miRNAs (red), while negative for downregulations (green).

