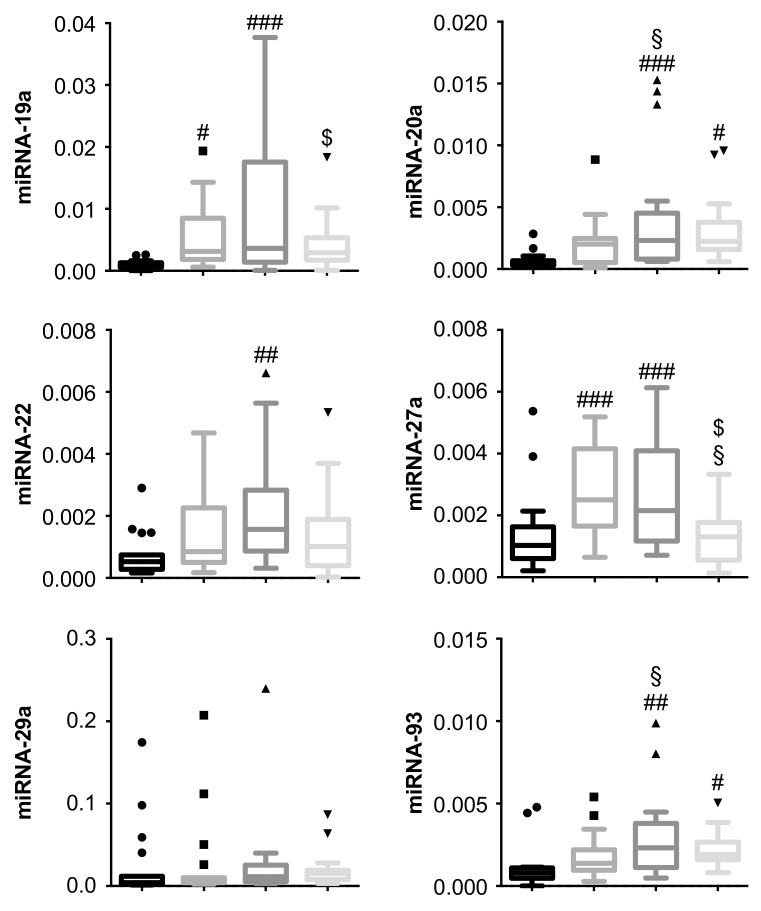
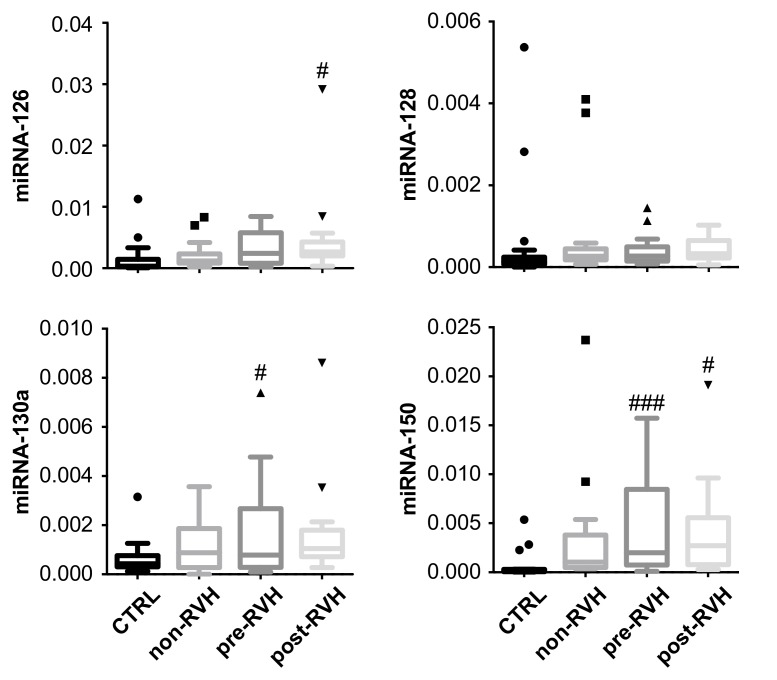
Figure 4.
Expression patterns of angiogenic miRNA in vitreous from the PDR and control patients. miRNA expression levels were evaluated by quantitative PCR and analyzed as relative expression (2−ΔCt) using Ce miRNA spike-in as the internal standard. Data represented as box-plots with Tukey correction (N = 18 per group). # p < 0.05, ## p < 0.01, ### p < 0.001 versus control (CTRL); § p < 0.05 versus non-RVH; $ p < 0.05 versus pre-RVH (one-way ANOVA with Fisher’s post hoc tests).


