Figure 5.
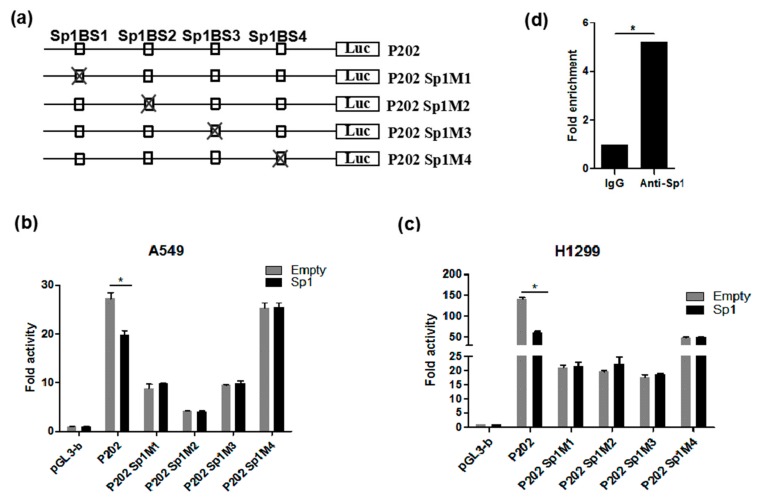
Functional analysis of Sp1 binding sites in the PDSS2 core promoter region. (a) Schematic diagram of site-directed mutagenesis of Sp1 binding sites in the PDSS2 core promoter. The four potential Sp1 binding sites are indicated as open boxes (Sp1CBS1, SpCBS2, Sp1CBS3, and Sp1CBS4). The indicated point mutation is denoted by a cross. (b,c) Luciferase reporter assays. The indicated luciferase reporter constructs were introduced into A549 (b) and H1299 (c) cells, and luciferase activities were determined as described in Figure 2 (* 0.01 < p < 0.05). (d) ChIP assay. Chromatin fragments were prepared from H1299 cells and immunoprecipitated with anti-Sp1 antibody or control IgG. The precipitated DNA was then amplified by real-time PCR with primers directed to the Sp1 binding sites in the PDSS2 core promoter region.

