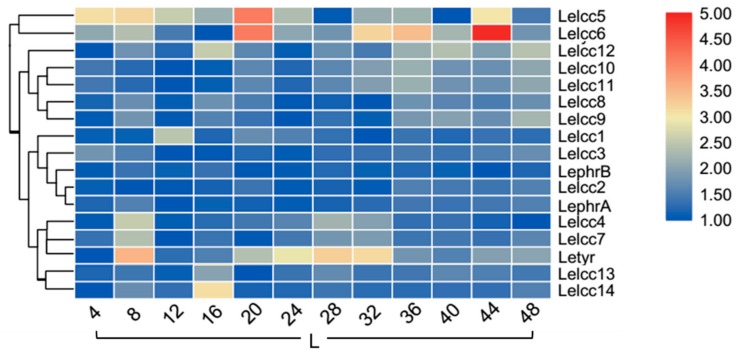
Figure 8.
Heatmap of the expression profiles of laccase genes from L. edodes (Lelcc) in the photoperiod (24 h light/0 h dark). The heat maps with hierarchical clustering were visualized using the software TBtools 0.665 and the values were log2-transformed with normalization. The blue and red elements indicate low and high relative expression levels, respectively.

