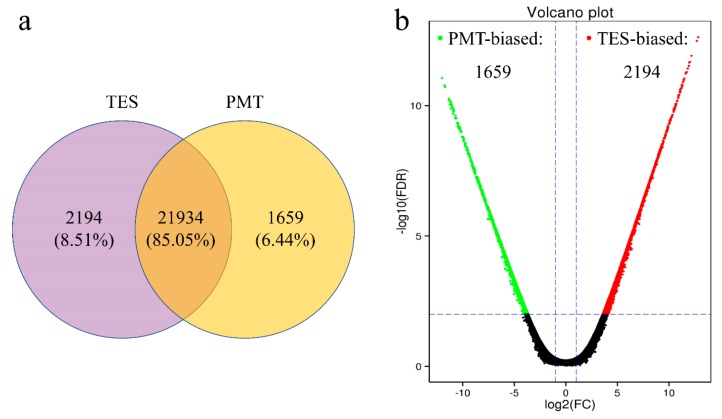
Figure 6.
Comparative results of RNA-Seq and differentially expressed gene distributions between the TES and PMT. (a) Venn diagram showing genes expressed highly in the TES (light purple circle), expressed highly in the PMT (light yellow circle), and expressed without significant difference in both samples (intersection). (b) Volcano scatter plot of differentially expressed genes (TES vs. PMT). Red points represent the testes-biased genes with log2 (fold change) > 2 and Q value < 0.01, i.e., −log10 (Q value) ≥ 2.0. Green points represent somatic-biased genes with log2 (fold change) < −2 and Q value < 0.01, i.e., −log10 (Q value) ≥ 2. Black points represent genes with no significant differences. Fold change equal to normalized gene expression of the TES/normalized gene expression of the PMT.

