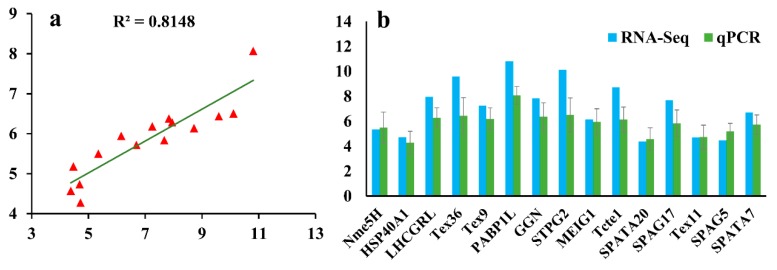
Figure 12.
Validation of RNA-Seq data using qPCR. (a) Consistency of log2FoldChange (log2FC) between RNA-Seq (X-axis) and qPCR assay (Y-axis) is high (R2 = 0.814) based on the 15 selected genes. (b) Log2FC of the selected DEGs by qPCR compared with RNA-Seq data. The log2FC values of qPCR are shown as the means ± standard error (SE).

